Running and Debugging WebAssembly from Hexana for VS Code
Hexana ships Run and Debug buttons in the editor toolbar. You can invoke a module through one of six runtimes (Wasmtime, WAMR, GraalVM, wazero, Node.js, or the browser) and (experimental) attach a debugger to all of them except GraalVM and wazero. Wasmtime 44+ uses the built-in gdbstub (since 0.10.0); older wasmtime and WAMR use an lldb-backed debugger (LLVM 22.1+ required); Node.js and Chrome use the Chrome DevTools Protocol (since 0.4.0). Node.js and the browser were added as run targets in 0.3.0; wazero was added in 0.6.0. Both core WebAssembly modules and Component Model binaries are supported, with different orchestration for each.
Requirements
| Tool | Required for | Install |
|---|---|---|
| wasmtime | Wasmtime runtime + Wasmtime debug | curl https://wasmtime.dev/install.sh -sSf \| bash, or via your package manager. |
| WAMR | WAMR runtime + WAMR debug | Build from source or grab a release binary. |
| GraalVM + GraalWasm | GraalVM runtime | Install GraalVM and the GraalWasm component; or let Hexana auto-detect. |
| wazero | wazero runtime (0.6.0+) | Install the wazero CLI and make sure it is on PATH. |
| wasm-tools | Component Model composition (preferred) | cargo install wasm-tools. |
| wac | Component Model composition (alternative) | cargo install wac-cli. |
| LLVM 22.1+ (for debug only) | WAMR debugging and Wasmtime older than 44 | Required because Hexana uses lldb 22.1+ wire-protocol features. |
| wasmtime 44+ | Wasmtime gdbstub debug path (0.10.0) | The gdbstub path is preferred; older wasmtime falls back to lldb with a visible warning. |
At least one runtime must be on PATH (or pointed at via the corresponding setting, e.g. hexana.wasmtimePath). wasm-tools / wac must be on PATH only when running component-model binaries with unresolved imports.
Core WebAssembly modules
How the Run flow works
- Click Run in the editor toolbar of an open
.wasm. - A dialog opens listing all exported functions and a runtime picker (Wasmtime / WAMR / GraalVM / wazero / Node.js / browser). Pick an entry point and the runtime. Under wazero the module is executed as a whole — individual exported-function invocation is not supported on that path.
- Optionally supply program arguments. Hexana parses the argument string using a shell-aware splitter (quoted strings are preserved as single arguments).
- Hexana checks for unresolved imports:
- All imports resolved: invokes the chosen runtime directly.
- Unresolved imports: Hexana generates import stubs — functions that satisfy the import signatures and do nothing (or trap, depending on the kind) — and supplies them via the runtime's preload / linking mechanism.
- A VS Code terminal opens with the runtime's command line, runs the export, and shows output.
The Run dialog is always shown so you can confirm runtime, export, and arguments before launch.
Generated import stubs
For an unresolved import like env.print_i32(i32) -> (), Hexana synthesises a minimal stub component that re-exports a noop with the matching signature, then preloads that stub at Wasmtime invocation. The user-facing effect: the run succeeds even when the WASM was compiled against a host the user hasn't fully wired up.
This is most useful for inspection runs — confirm that a function is callable and see what it computes from constant inputs — and least useful when the host functions are part of the program's semantics (e.g. an export whose result depends on what env.read_file returns).
Component Model binaries
How the Run flow works
- Click Run on a component binary.
- Hexana inspects the component's imports and tries to satisfy them by scanning the workspace.
- Dependency resolution (see
component-model.mdfor the full algorithm) walks every.wasmin the workspace, identifies components that export the interfaces the target imports, and chains them transitively. - If all imports are resolved through workspace components:
- Composition runs
wasm-tools compose(orwac plugifwasm-toolsis unavailable) to produce a single self-contained component. - Invocation runs the chosen runtime on the composed component.
- If imports remain unresolved, Hexana falls back to import-stub generation (same as core modules).
Composition tool selection
| Tool | When Hexana picks it |
|---|---|
wasm-tools compose |
First choice. Mainstream Bytecode Alliance tool, broader support. |
wac plug |
Fallback when wasm-tools is not on PATH. |
You can install only one — Hexana adapts. If neither is installed and your binary has unresolved component imports, the Run flow stops with an actionable error pointing you at the install commands.
Run dialog
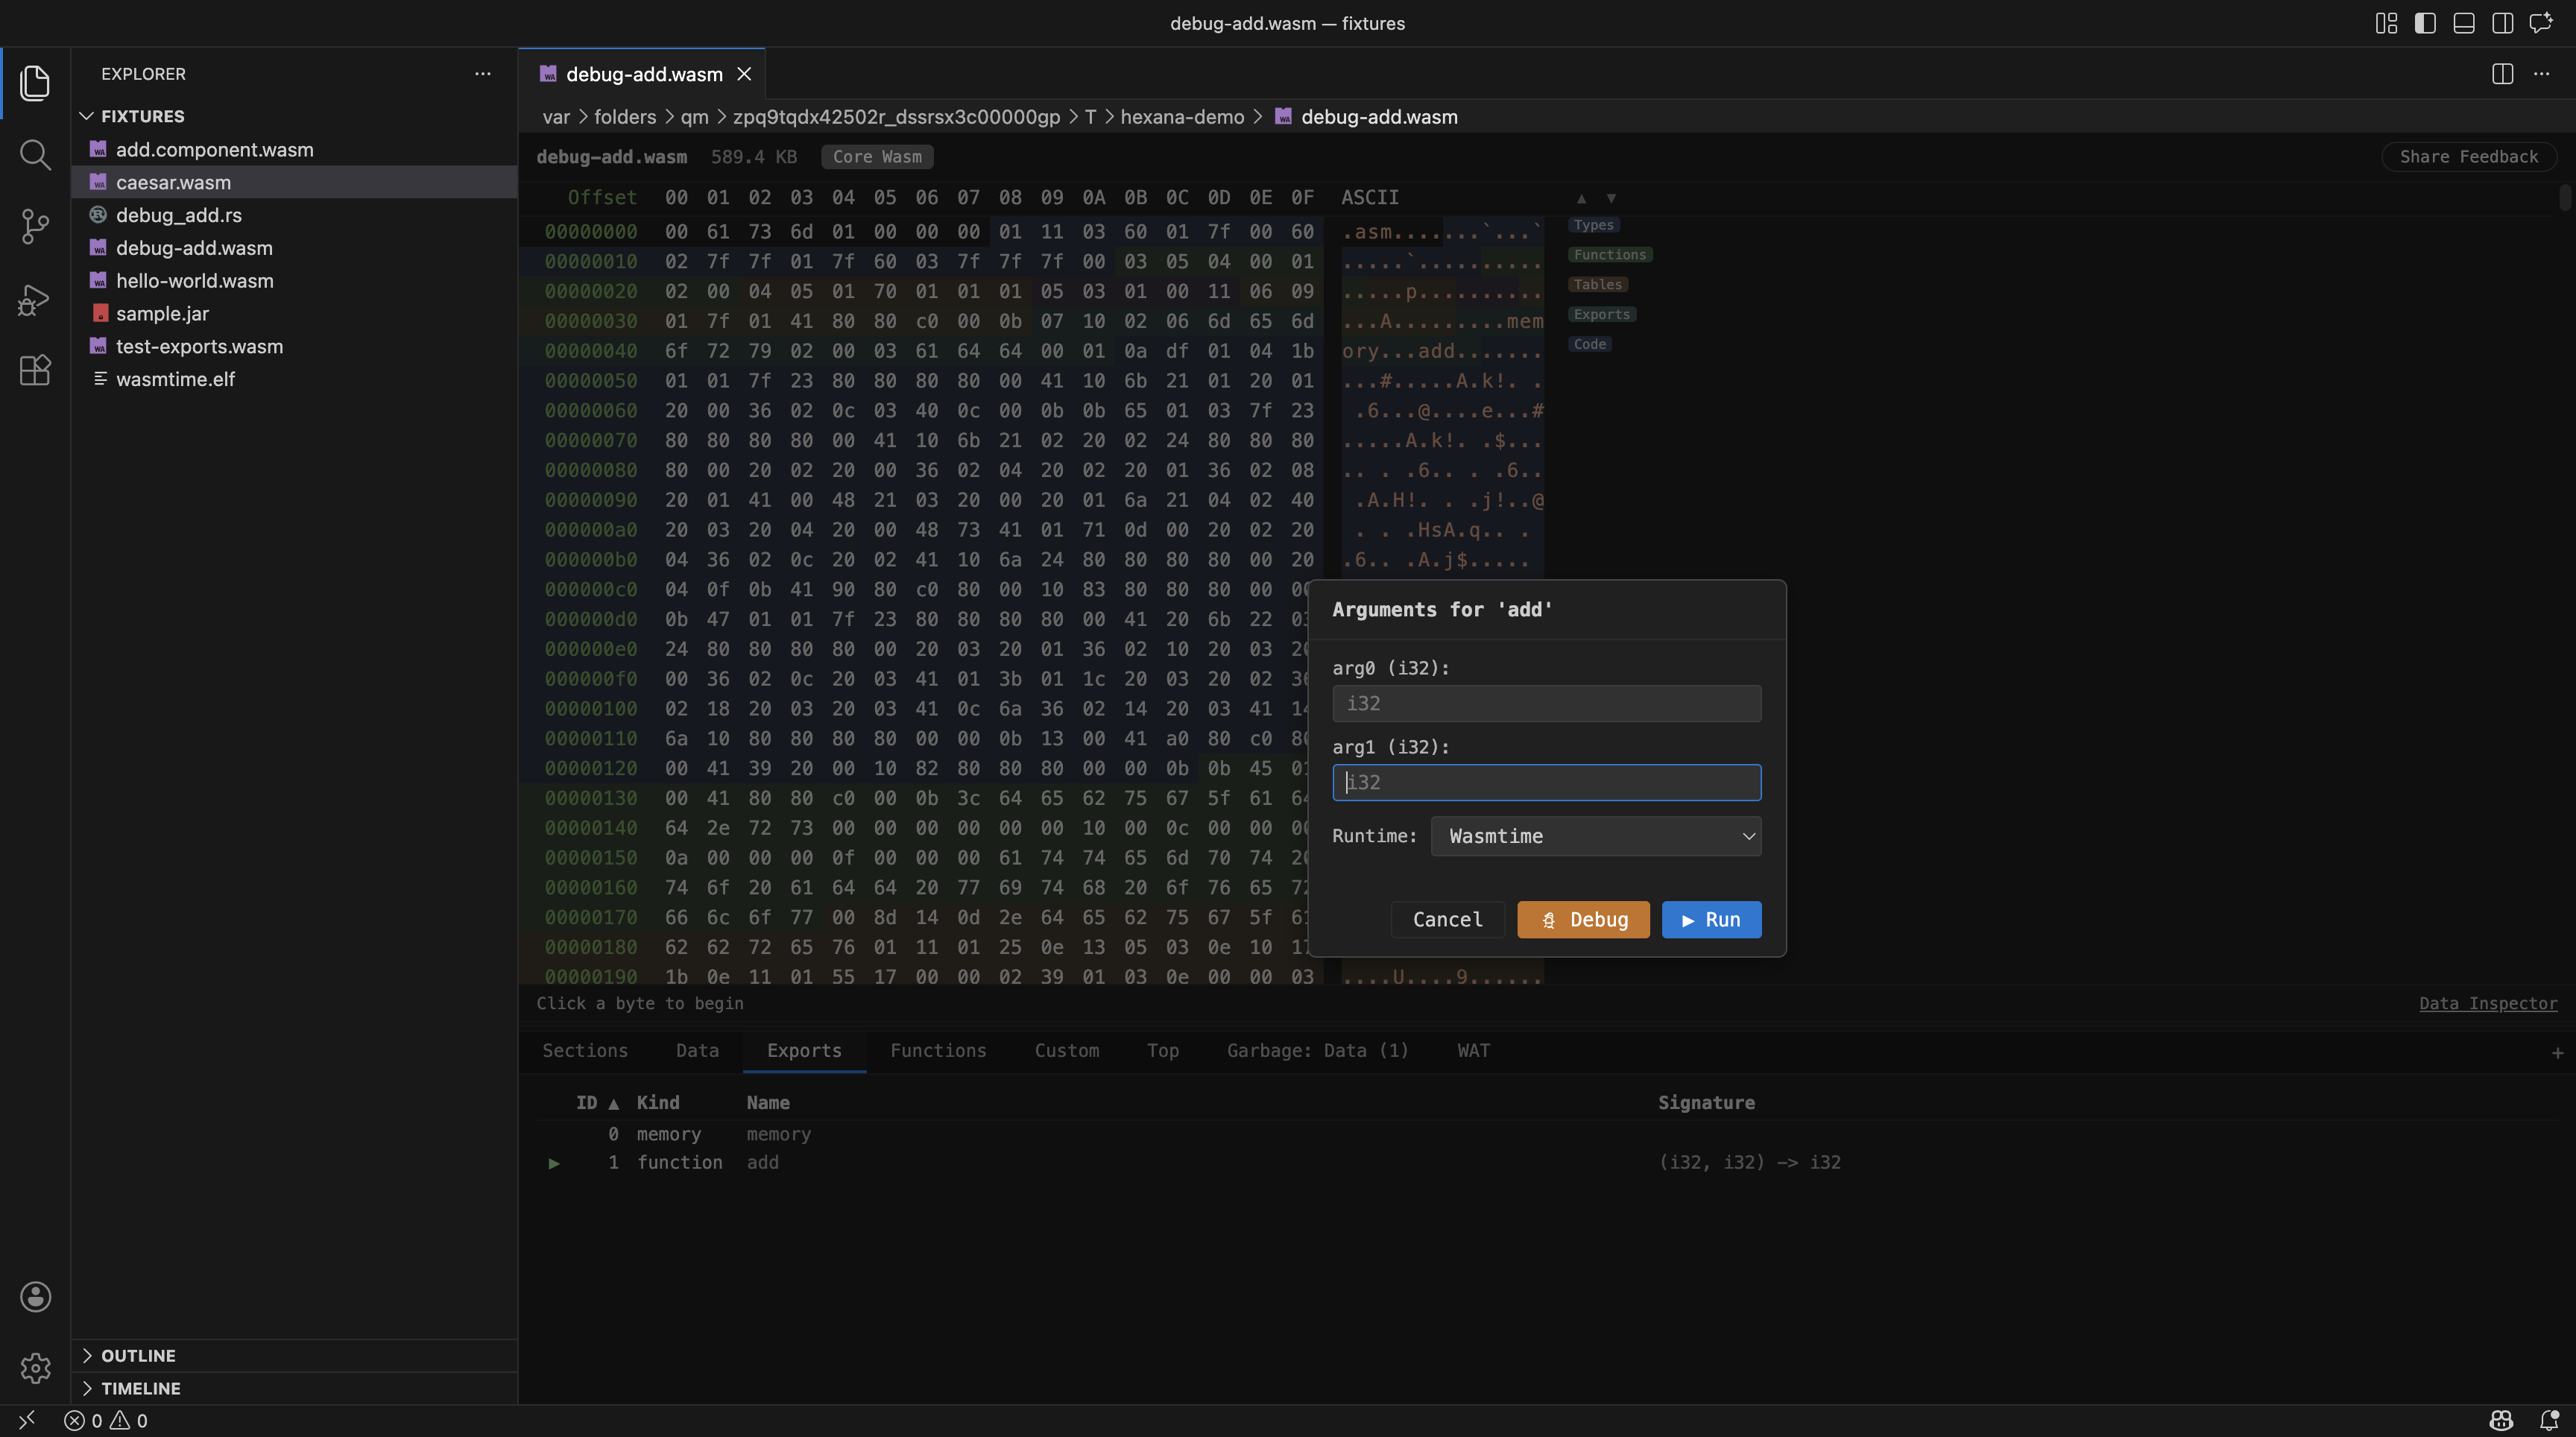
The dialog has four sections:
- Runtime — dropdown of detected runtimes (Wasmtime / WAMR / GraalVM / wazero / Node.js / browser). Unavailable runtimes are greyed out with a tooltip explaining why. All runtimes except GraalVM and wazero can also be debugged (see Debugging).
- Export — dropdown of all exported functions (core modules) or the component's primary entry interface (components).
- Arguments — free-text field. Shell-style quoting is supported via Hexana's
splitShellArgsKotlin/JS utility. Backslash escapes work for spaces; single and double quotes group arguments. - Environment (implicit) — Hexana passes through your current shell environment to the chosen runtime.
Click Run (or Debug to launch under the debugger — see below) to start; the dialog closes and a terminal opens with the live invocation.
Debugging (experimental)
Click Debug instead of Run to launch the module under a debugger. Hexana has three debug backends, selected by the runtime and its version; GraalVM is run-only.
gdbstub-backed: Wasmtime 44+ (0.10.0)
The preferred Wasmtime debug path since 0.10.0:
- The module runs under
wasmtime run -g. LLDB attaches through the wasm process plugin. - DWARF is read directly from the wasm binary, removing the JIT-loader and trap-advance workarounds of the native path.
- When the resolved wasmtime is older than 44, the extension checks wasmtime's own installer location (
~/.wasmtime/bin), and only then falls back to native debugging with a visible warning in the Output channel. - The operand stack (slot, type, value) is available via the "Wasm" debugger view using the gdbstub stack accessor.
lldb-backed: Wasmtime (older than 44) and WAMR
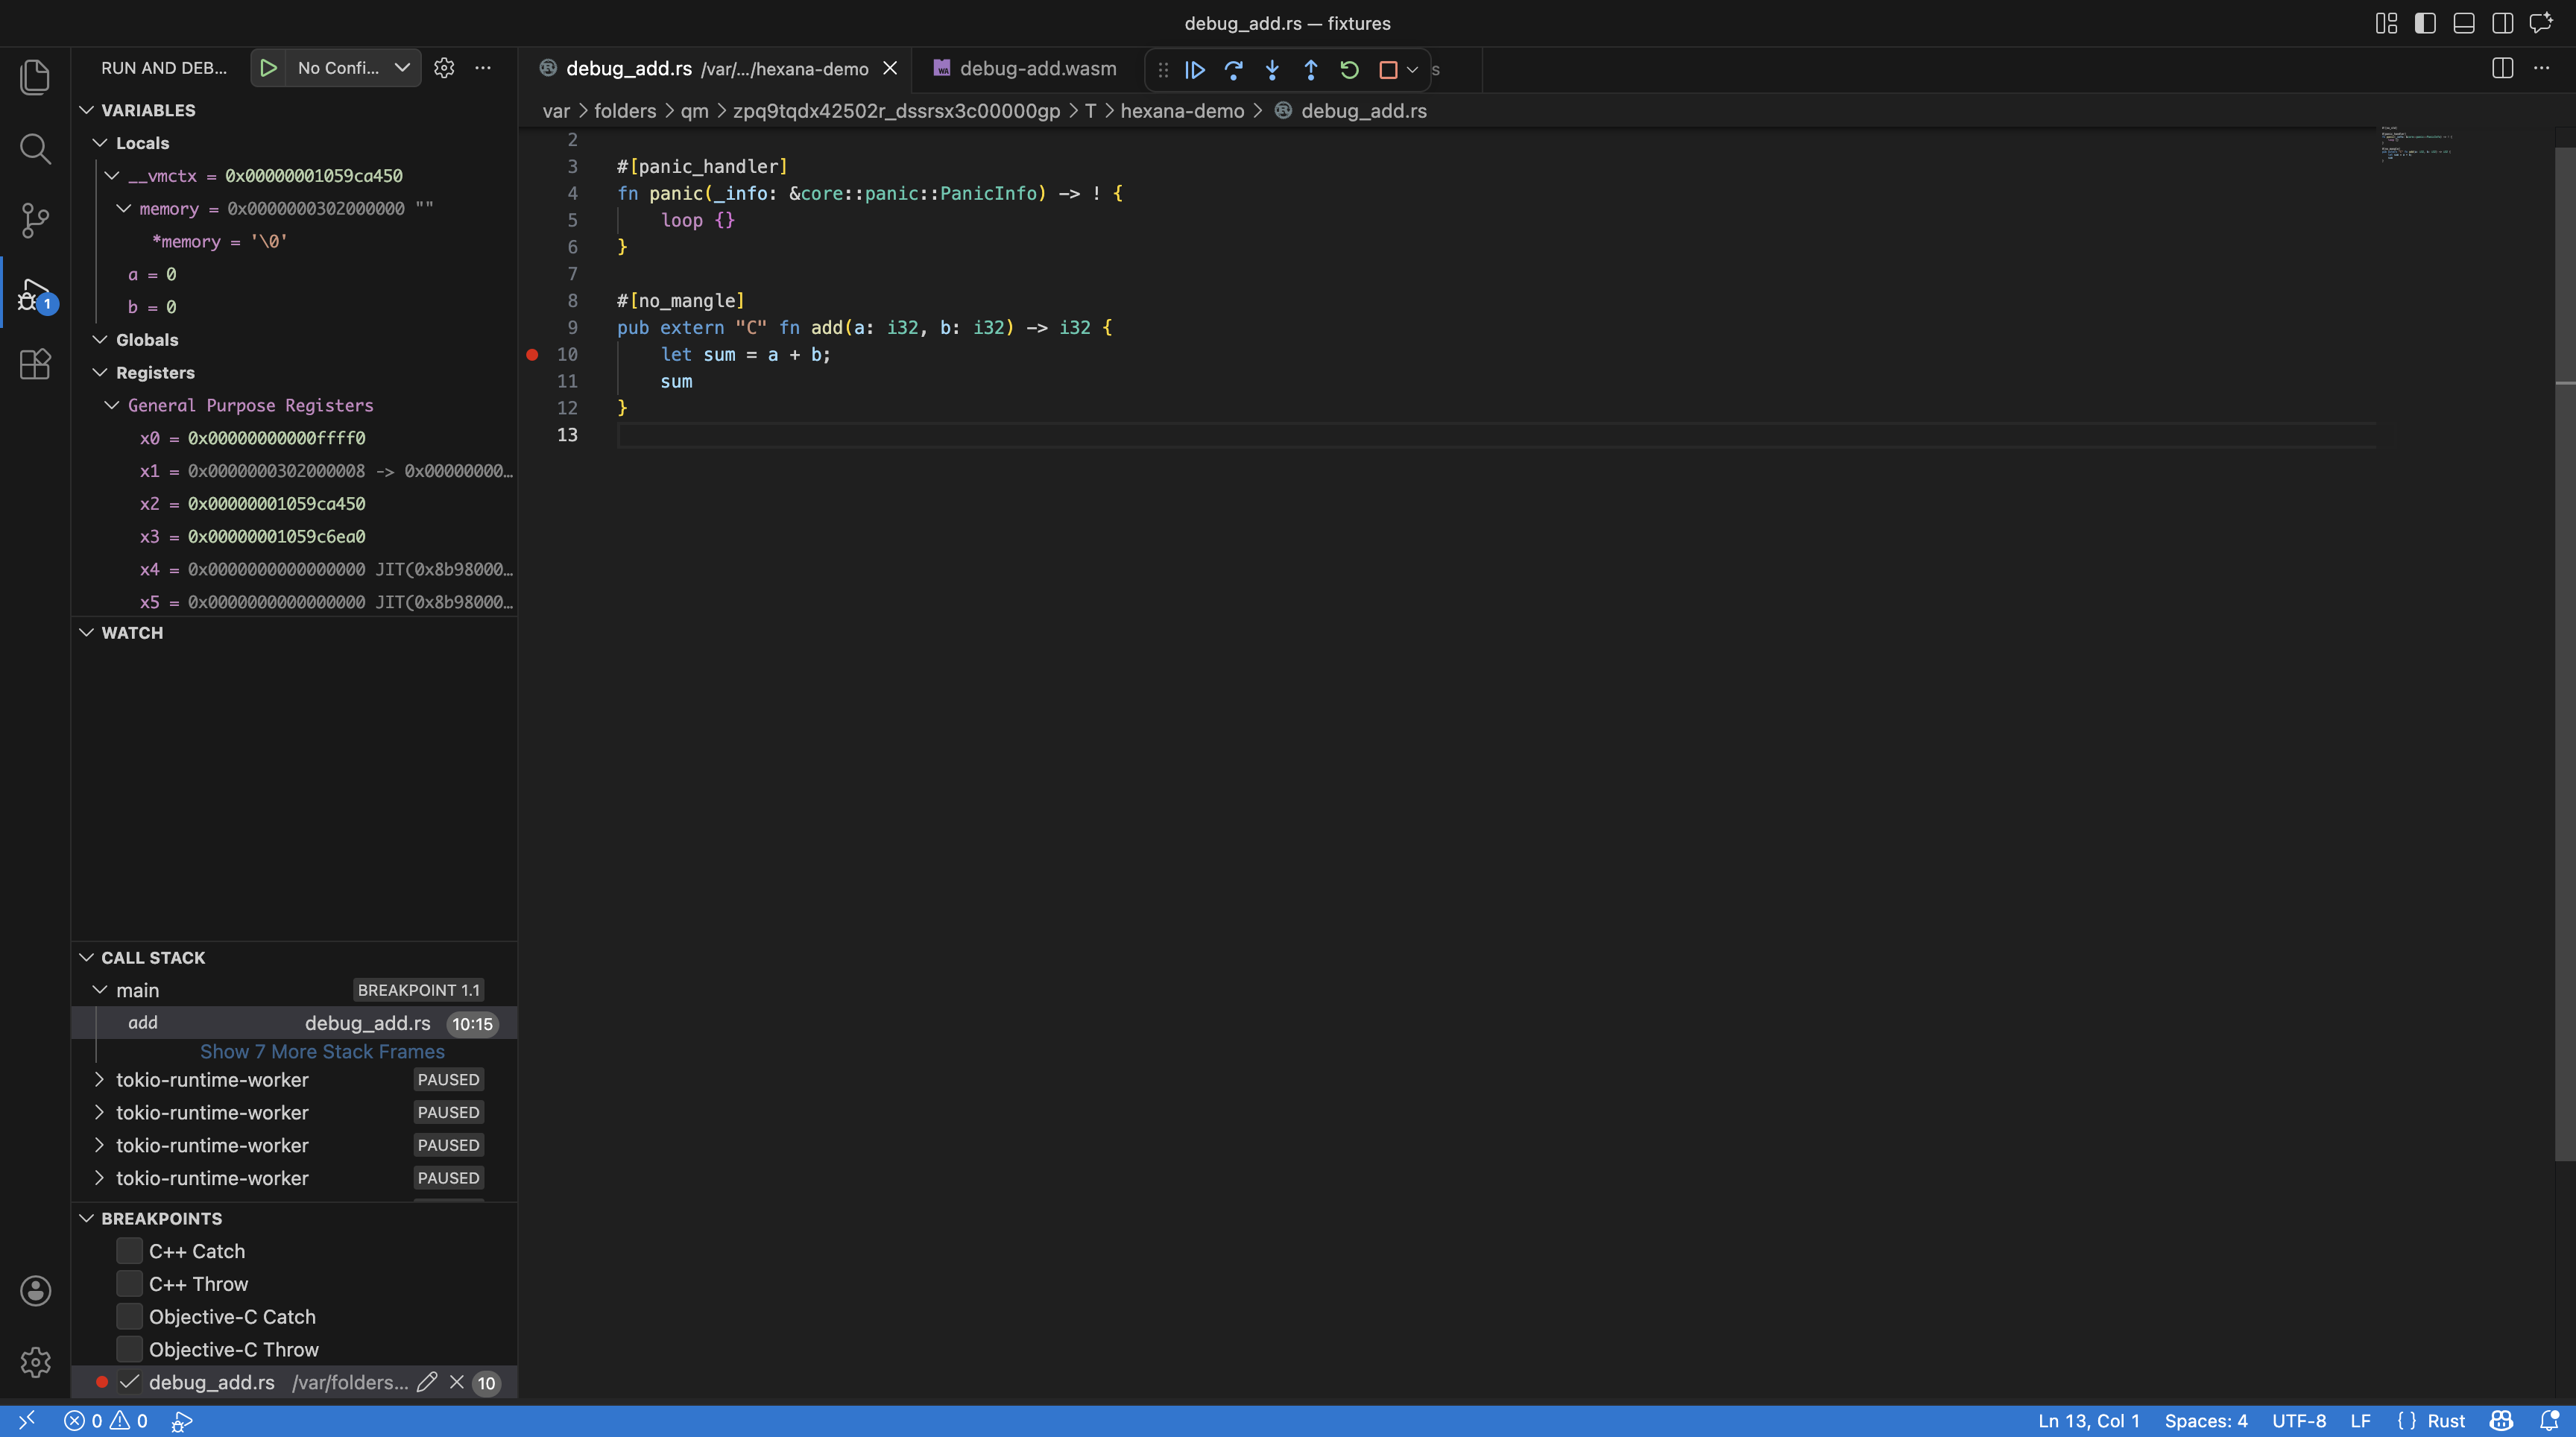
- Requirements — LLVM 22.1 or newer must be on
PATH, and the WASM binary must be compiled with debug info thatlldbcan interpret. - Breakpoints — set them in source files associated with the module (Hexana maps PCs to source via DWARF). Breakpoints inside nested modules of a Component Model binary are supported on Wasmtime only.
- Stepping — step over, into, and out; continue past hit breakpoints.
- Variables — local-variable inspection works for compilers that emit DWARF with reasonable location expressions (Rust, C/C++, Emscripten with
-g).
CDP-backed — Node.js and Chrome (0.4.0)
Choosing Debug with the Node.js or browser runtime drives the runtime over the Chrome DevTools Protocol (CDP) instead of lldb:
- Node.js is launched with
--inspect-brk; Chrome with--remote-debugging-port. Hexana connects over a CDP WebSocket and translates DAP ↔ CDP so VS Code's standard debugger UI (breakpoints, stepping, call stack, variables) works against the WASM running in the JS host. - Chrome/Chromium is located from common install locations for your platform; install Google Chrome (or a Chromium build) to use the browser path.
- No LLVM is required for this backend.
- Source-level stepping (0.10.0): a step repeats V8's per-instruction wasm step until the DWARF source line or stack depth changes. Frames without DWARF info keep single-instruction steps.
- Inlined call frames (0.10.0): inlined frames are marked "(inlined)" in the call stack; variables and evaluation stay on the physical frame.
- Conditional breakpoints (0.10.0): conditions are evaluated by V8; expressions referencing wasm-level names work directly.
- Linear-memory variables (0.10.0): structs, arrays, and enums stored in linear memory are located via DWARF, read from the module's memory, and decoded per type in the Variables view.
"Wasm" debugger view (0.10.0)
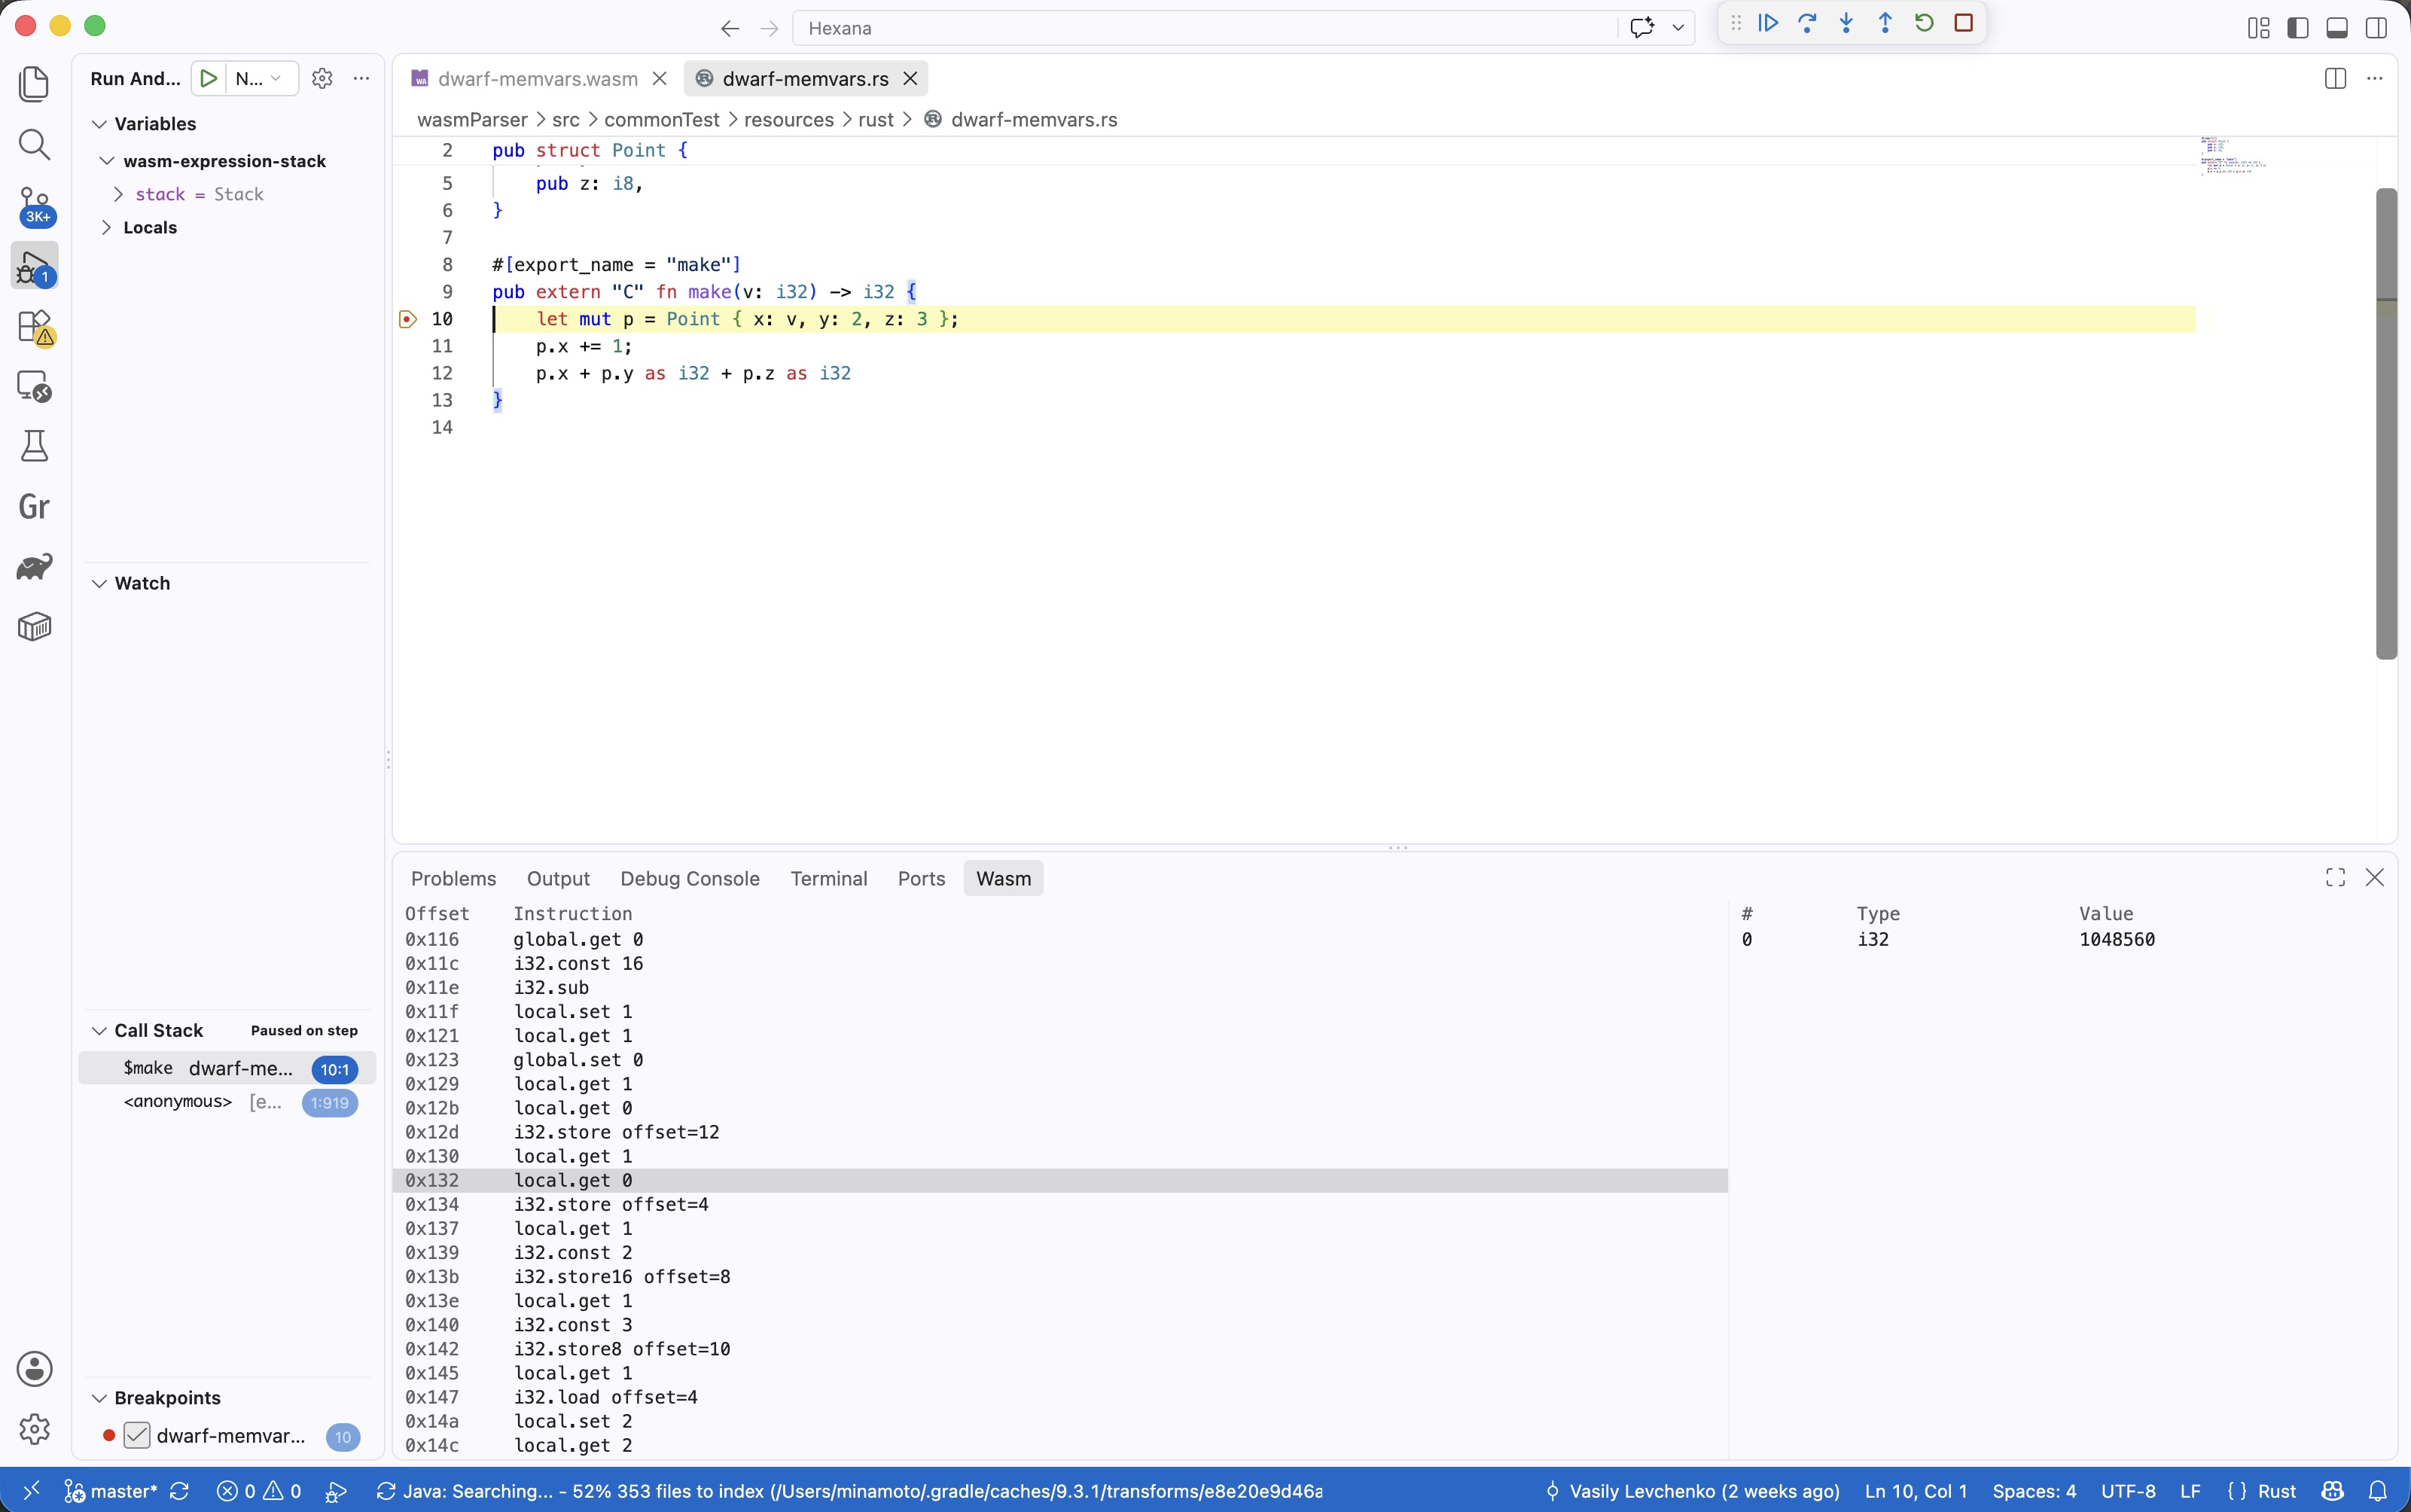
"Hexana: Open Wasm View" opens a panel in the bottom area (next to the Debug Console) showing:
- WAT-style disassembly of the paused function, with the current instruction highlighted.
- The operand stack on the right: slot index, type, and value.
While the view is visible, each step moves one wasm instruction. When the view is hidden, stepping returns to source-line granularity. Available for nodejs, browser, wasmtime gdbstub, and WAMR sessions. For Component Model binaries, disassembly and the operand stack resolve against the embedded core module the debug stub reports.
Disassembly View integration (0.10.0)
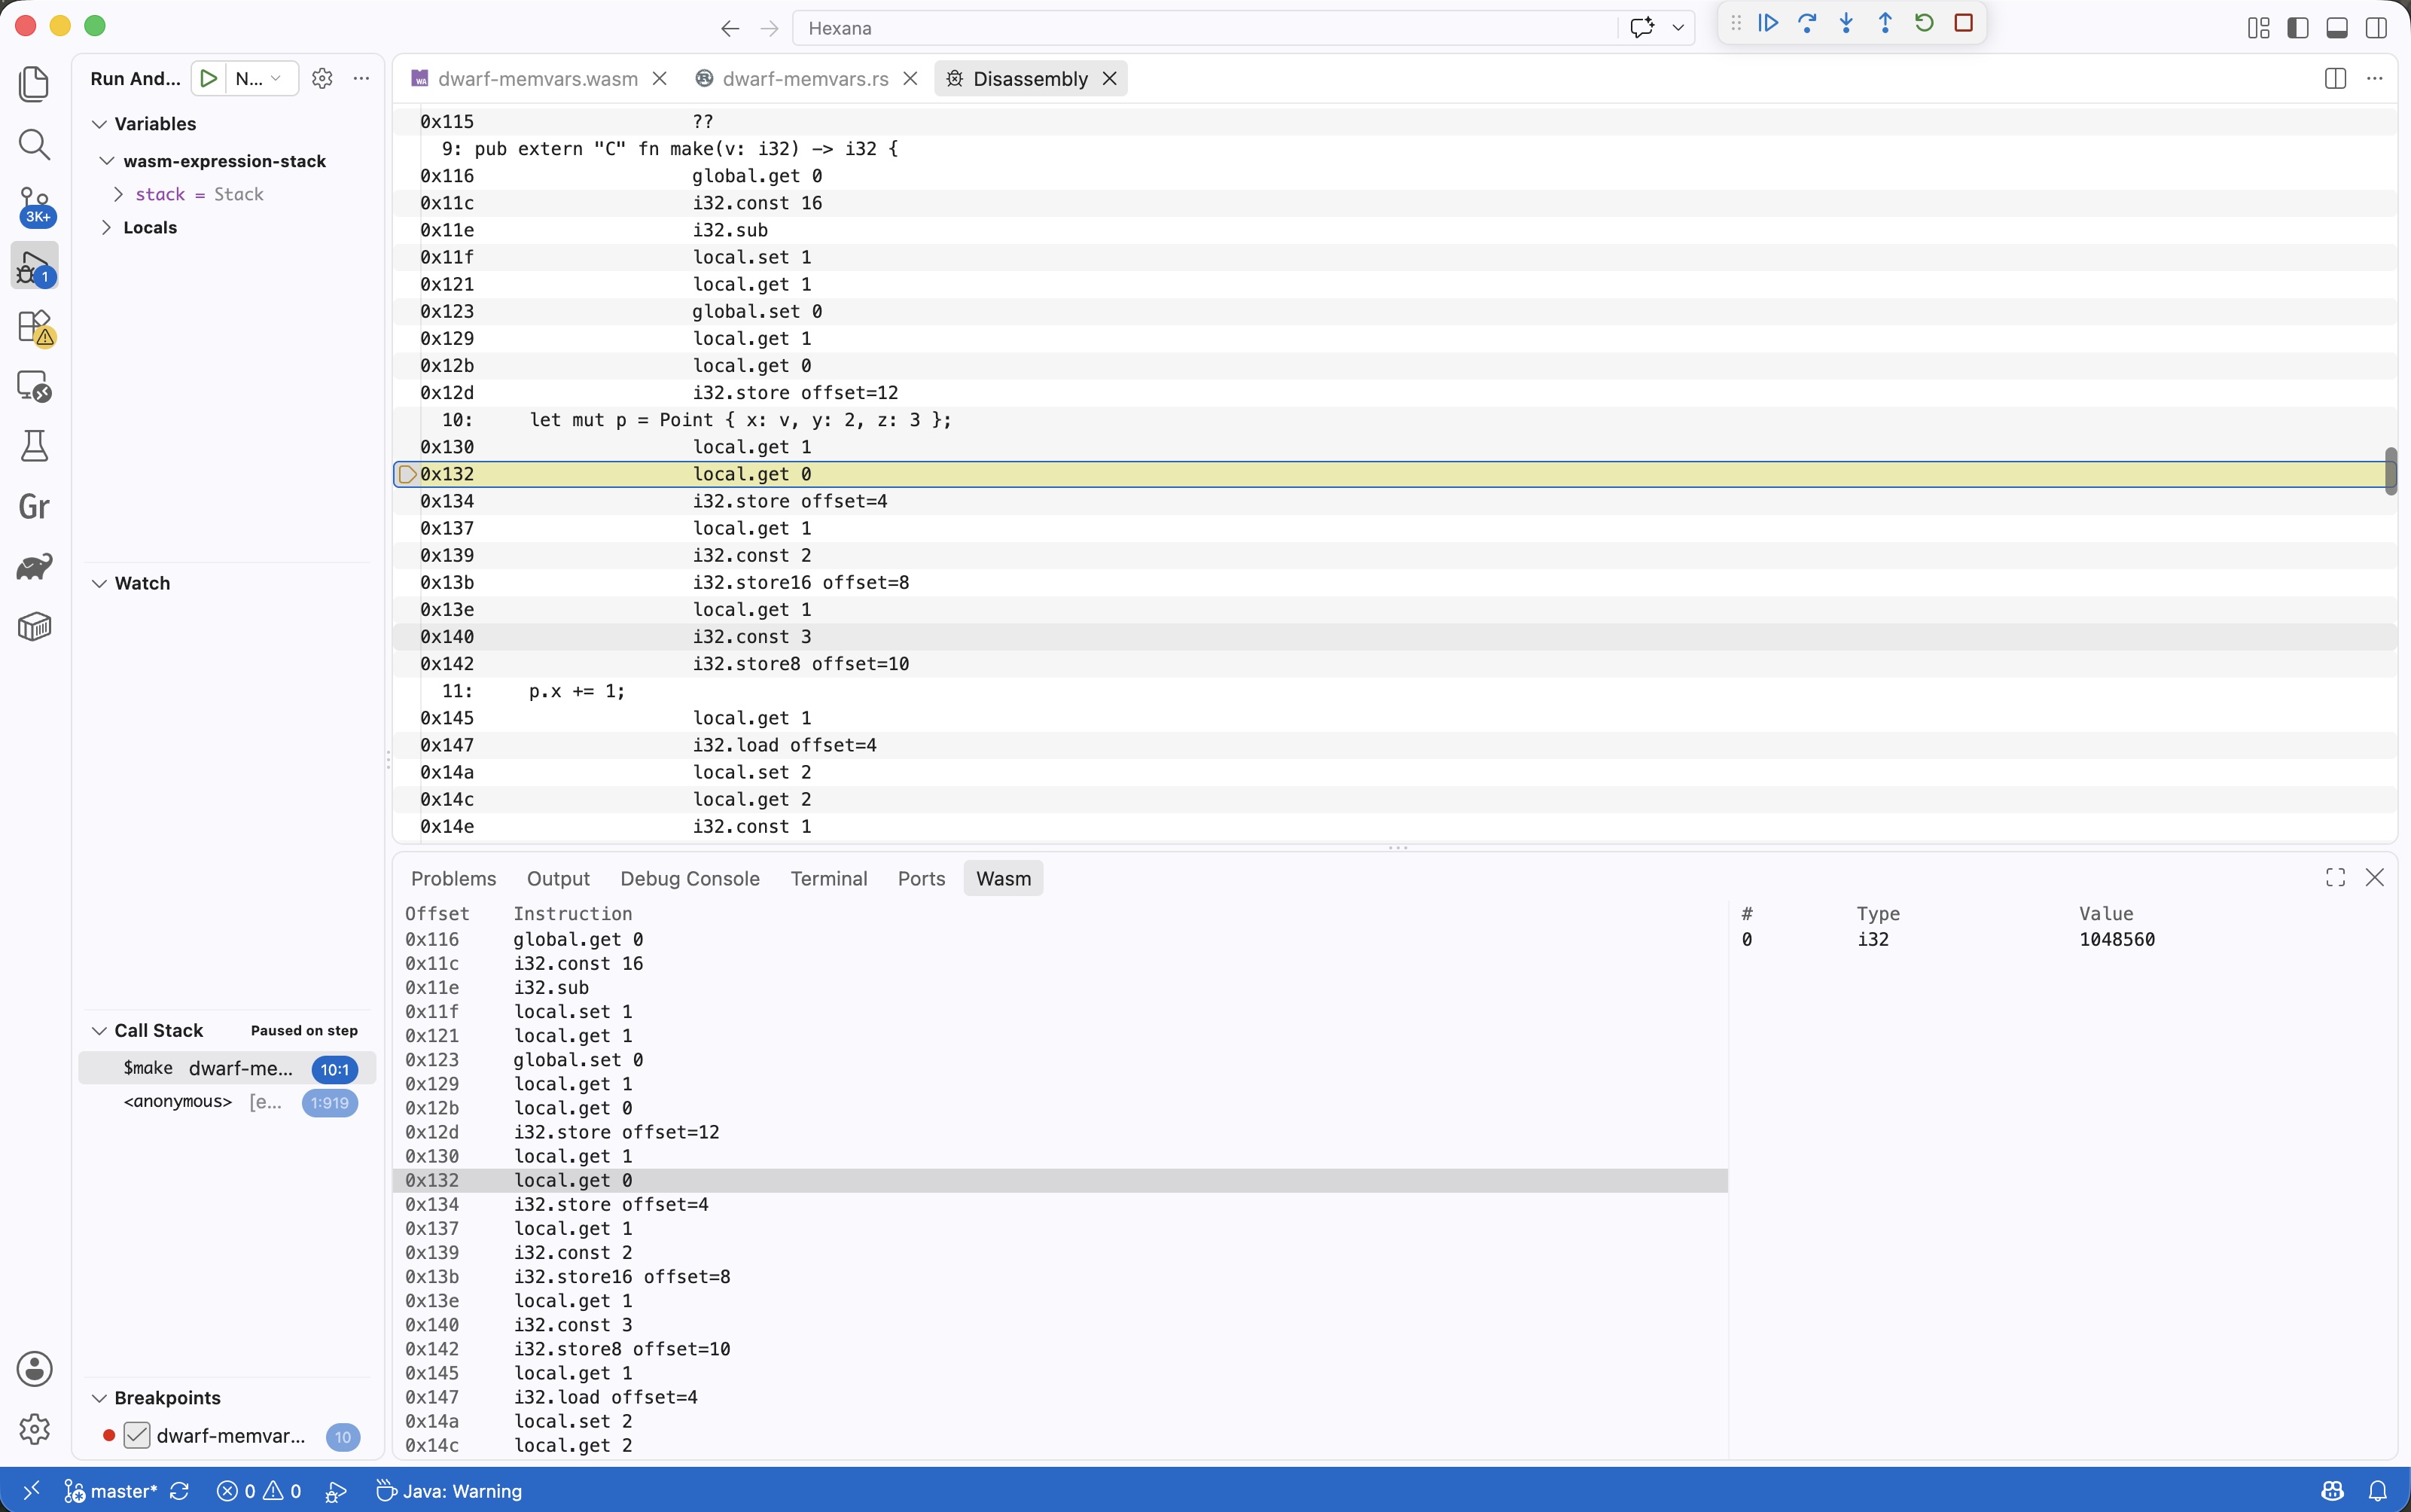
"Open Disassembly View" while paused in a nodejs or browser wasm debug session opens VS Code's built-in Disassembly View with:
- One WAT-style instruction per row.
- Module-absolute byte offsets as addresses.
- Interleaved DWARF source location annotations.
While the view is focused, stepping switches to per-instruction granularity, matching the Wasm view behavior.
Managed wasi-sdk (0.10.0)
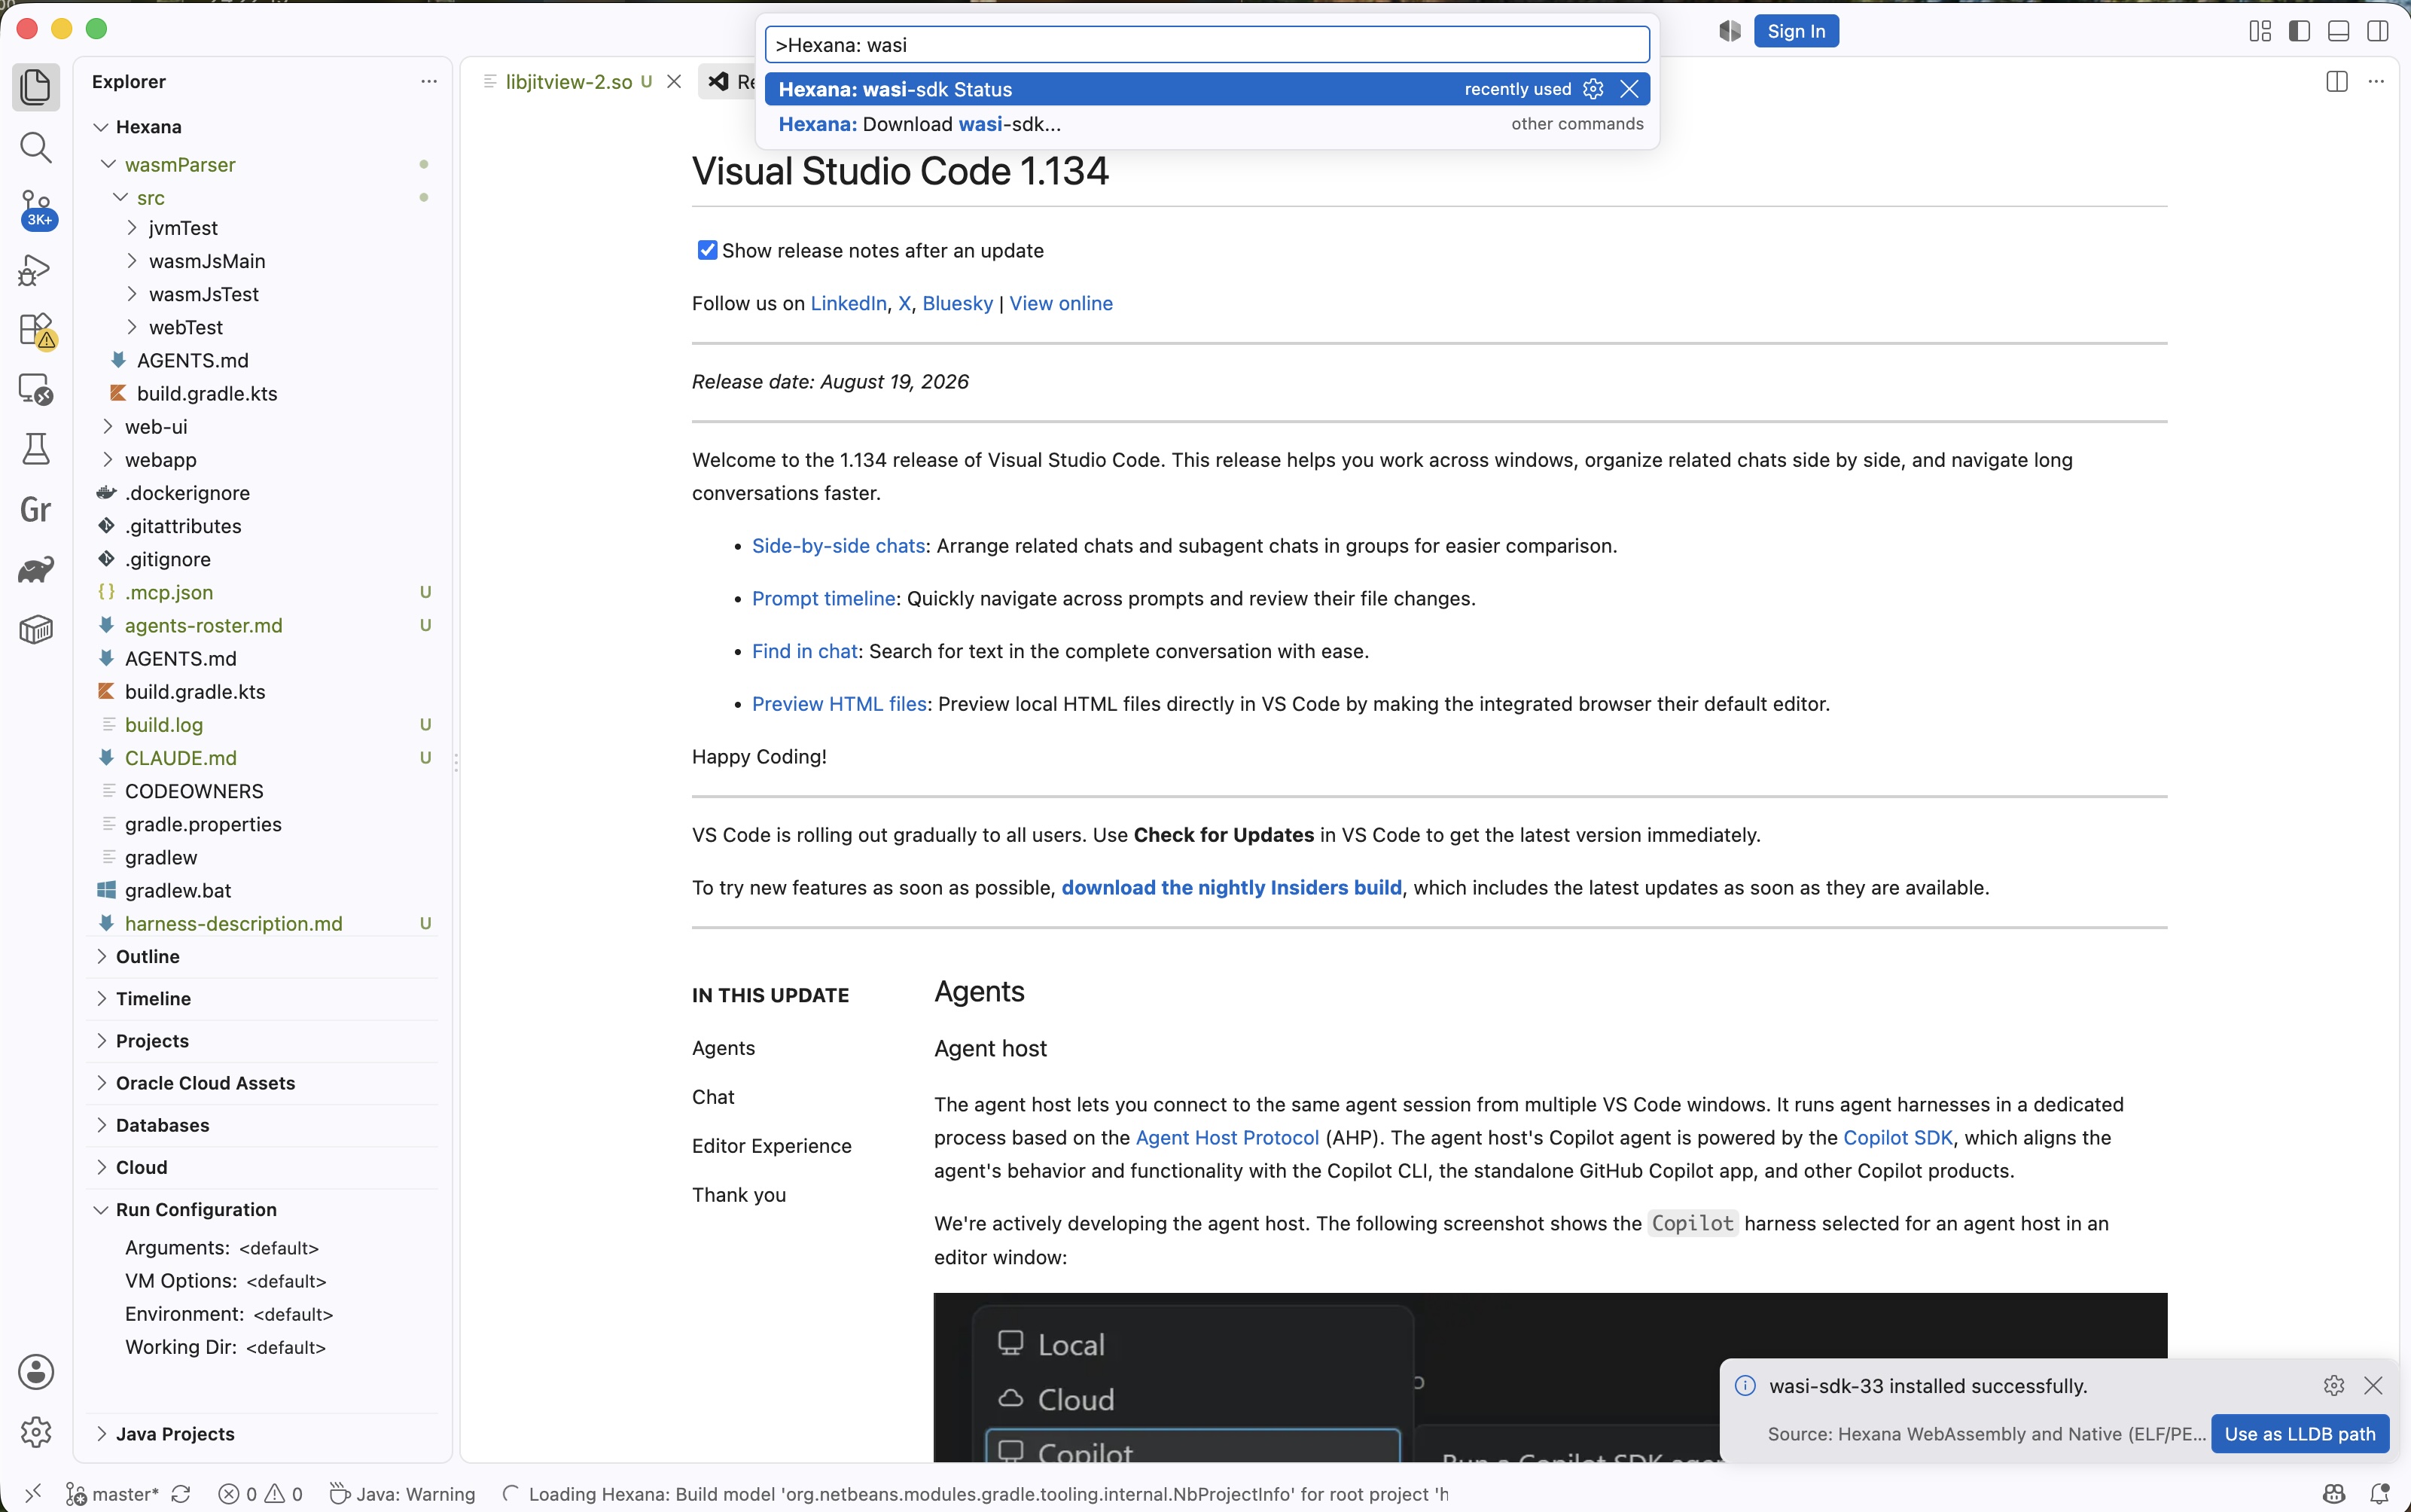
- "Hexana: Download wasi-sdk..." lists GitHub releases with sizes shown, sha256-verified, and cancellable. Versions install side by side into the extension's global storage; one download serves all workspaces.
- "Hexana: wasi-sdk Status" shows the active version with update and version-switch actions.
- The SDK takes effect only via an explicit "Use as LLDB path" button, which writes the
hexana.lldbPathsetting. The lldb resolution order is otherwise unchanged.
Known limitations:
- GraalVM debug is not wired (run-only).
- wazero debug is not wired (run-only).
- Some compilers' DWARF (especially aggressive-CGU Rust builds) produces source paths that need fuzzy matching; if a breakpoint does not bind, check the Debug Console for the path Hexana tried to resolve and file a tracker issue.
Terminal output
Each run gets its own VS Code terminal named after the run target (export name or component path). Stderr and stdout are shown verbatim — Hexana does not parse or filter the runtime's output. Use the terminal's normal search and copy.
Killing the terminal kills the runtime process.
Configuration
| Setting | Default | Effect |
|---|---|---|
hexana.wasmtimePath |
"" (use PATH) |
Absolute path to a specific Wasmtime executable. Useful for testing pre-release builds or pinning to a vendored copy. |
hexana.mcp.javaHome |
"" (use JAVA_HOME / PATH) |
Absolute path to a JDK 21+ home directory. Only relevant when the MCP server is enabled (used by AI tooling); not required for Run / Debug. |
There is no setting to override wasm-tools, wac, WAMR, or GraalVM paths — all must be on PATH (GraalVM is auto-detected from common install locations as well).
What this version does not do
- GraalVM debug is not wired. GraalVM is run-only. (Wasmtime uses the gdbstub path since 0.10.0 or
lldbon older wasmtime; WAMR useslldb; Node.js / Chrome use CDP since 0.4.0.) - wazero is run-only, modules only. Debugging under wazero is not wired, and individual exported-function invocation is not supported on the wazero path.
- No proposal-flag selection UI. Hexana detects which proposals the binary uses and passes the appropriate
--wasm-featuresflags automatically, but there is no UI to override. - No run-configuration persistence. Each Run is ad-hoc; arguments are not saved between runs. The dialog remembers the last set within the editor session but discards them on close.
- No host-function injection. You cannot supply your own implementations for unresolved imports; you get auto-generated stubs or nothing.
Troubleshooting
If Run is greyed out:
- Check Wasmtime is installed and on
PATH, or thathexana.wasmtimePathpoints at the executable. - Reload the editor (
Cmd/Ctrl+Shift+P→ Developer: Reload Window) so the extension re-detects.
If Run fails on a component binary with "unable to compose":
- Install
wasm-tools(cargo install wasm-tools). - Confirm all required dependency
.wasmfiles are present in the workspace. - See
component-model.md#dependency-resolutionfor the resolution algorithm.
See troubleshooting.md for the full list.
See also
features.md,component-model.md,settings.md,troubleshooting.md.- The Bytecode Alliance docs for wasmtime, wasm-tools, and wac.