Hexana for VS Code — Feature Reference
This page enumerates every user-visible capability Hexana ships for VS Code. For per-tab details on the analysis panels, see analysis-tabs.md. For per-release changes, see changelog.md.
Custom binary editor
Hexana registers a CustomReadonlyEditorProvider (hexana.wasmEditor) for files matching *.wasm. When you open a .wasm, VS Code uses this editor by default — workbench.editorAssociations is set to {"*.wasm": "hexana.wasmEditor"} automatically on install.
Since 0.4.0 the hex viewer supports in-place byte editing: select a byte, type a new value, and persist the change to the original file with the overwrite-file action. Editing is overwrite-only — the file size never changes (you cannot insert or delete bytes). Editing the structured WAT view, as in the JetBrains plugin, is not available in VS Code.
Automatic binary kind detection
Seven kinds are detected and badged in the editor toolbar:
| Badge | Detection |
|---|---|
core |
Standard core WebAssembly module (magic \0asm, version 1). |
component |
Component Model binary (magic \0asm, version 0x0a, layer 1). |
wasm |
Falls back to generic when neither kind matches but the file is otherwise WebAssembly. |
native |
ELF, Mach-O, or PE binary detected from magic bytes. |
class / dex |
Java .class file or Android DEX file, opened directly in the hex viewer (0.5.0). |
parquet / arrow |
Apache Parquet and Apache Arrow IPC files, opened with Schema, Row Groups / Record Batches, Metadata, and Data tabs (0.12.0). |
pcap / pcapng |
Network capture files, opened with Header and Packets tabs (0.10.0). |
Tab availability adapts per kind — Component Model files surface a Modules tab; core modules surface Functions, Data, Custom, Monos, Garbage; native binaries surface a structure tab covering sections, segments, and symbols.
Content-based opening (0.12.0+)
Binaries whose filename gives no format hint open by content. An extensionless WebAssembly module, Parquet file, or Arrow export gets its full editor instead of a hex dump. Files that Hexana claims by extension continue to open automatically; files with unknown extensions can also be opened via Reopen Editor With (see below).
Hex viewer
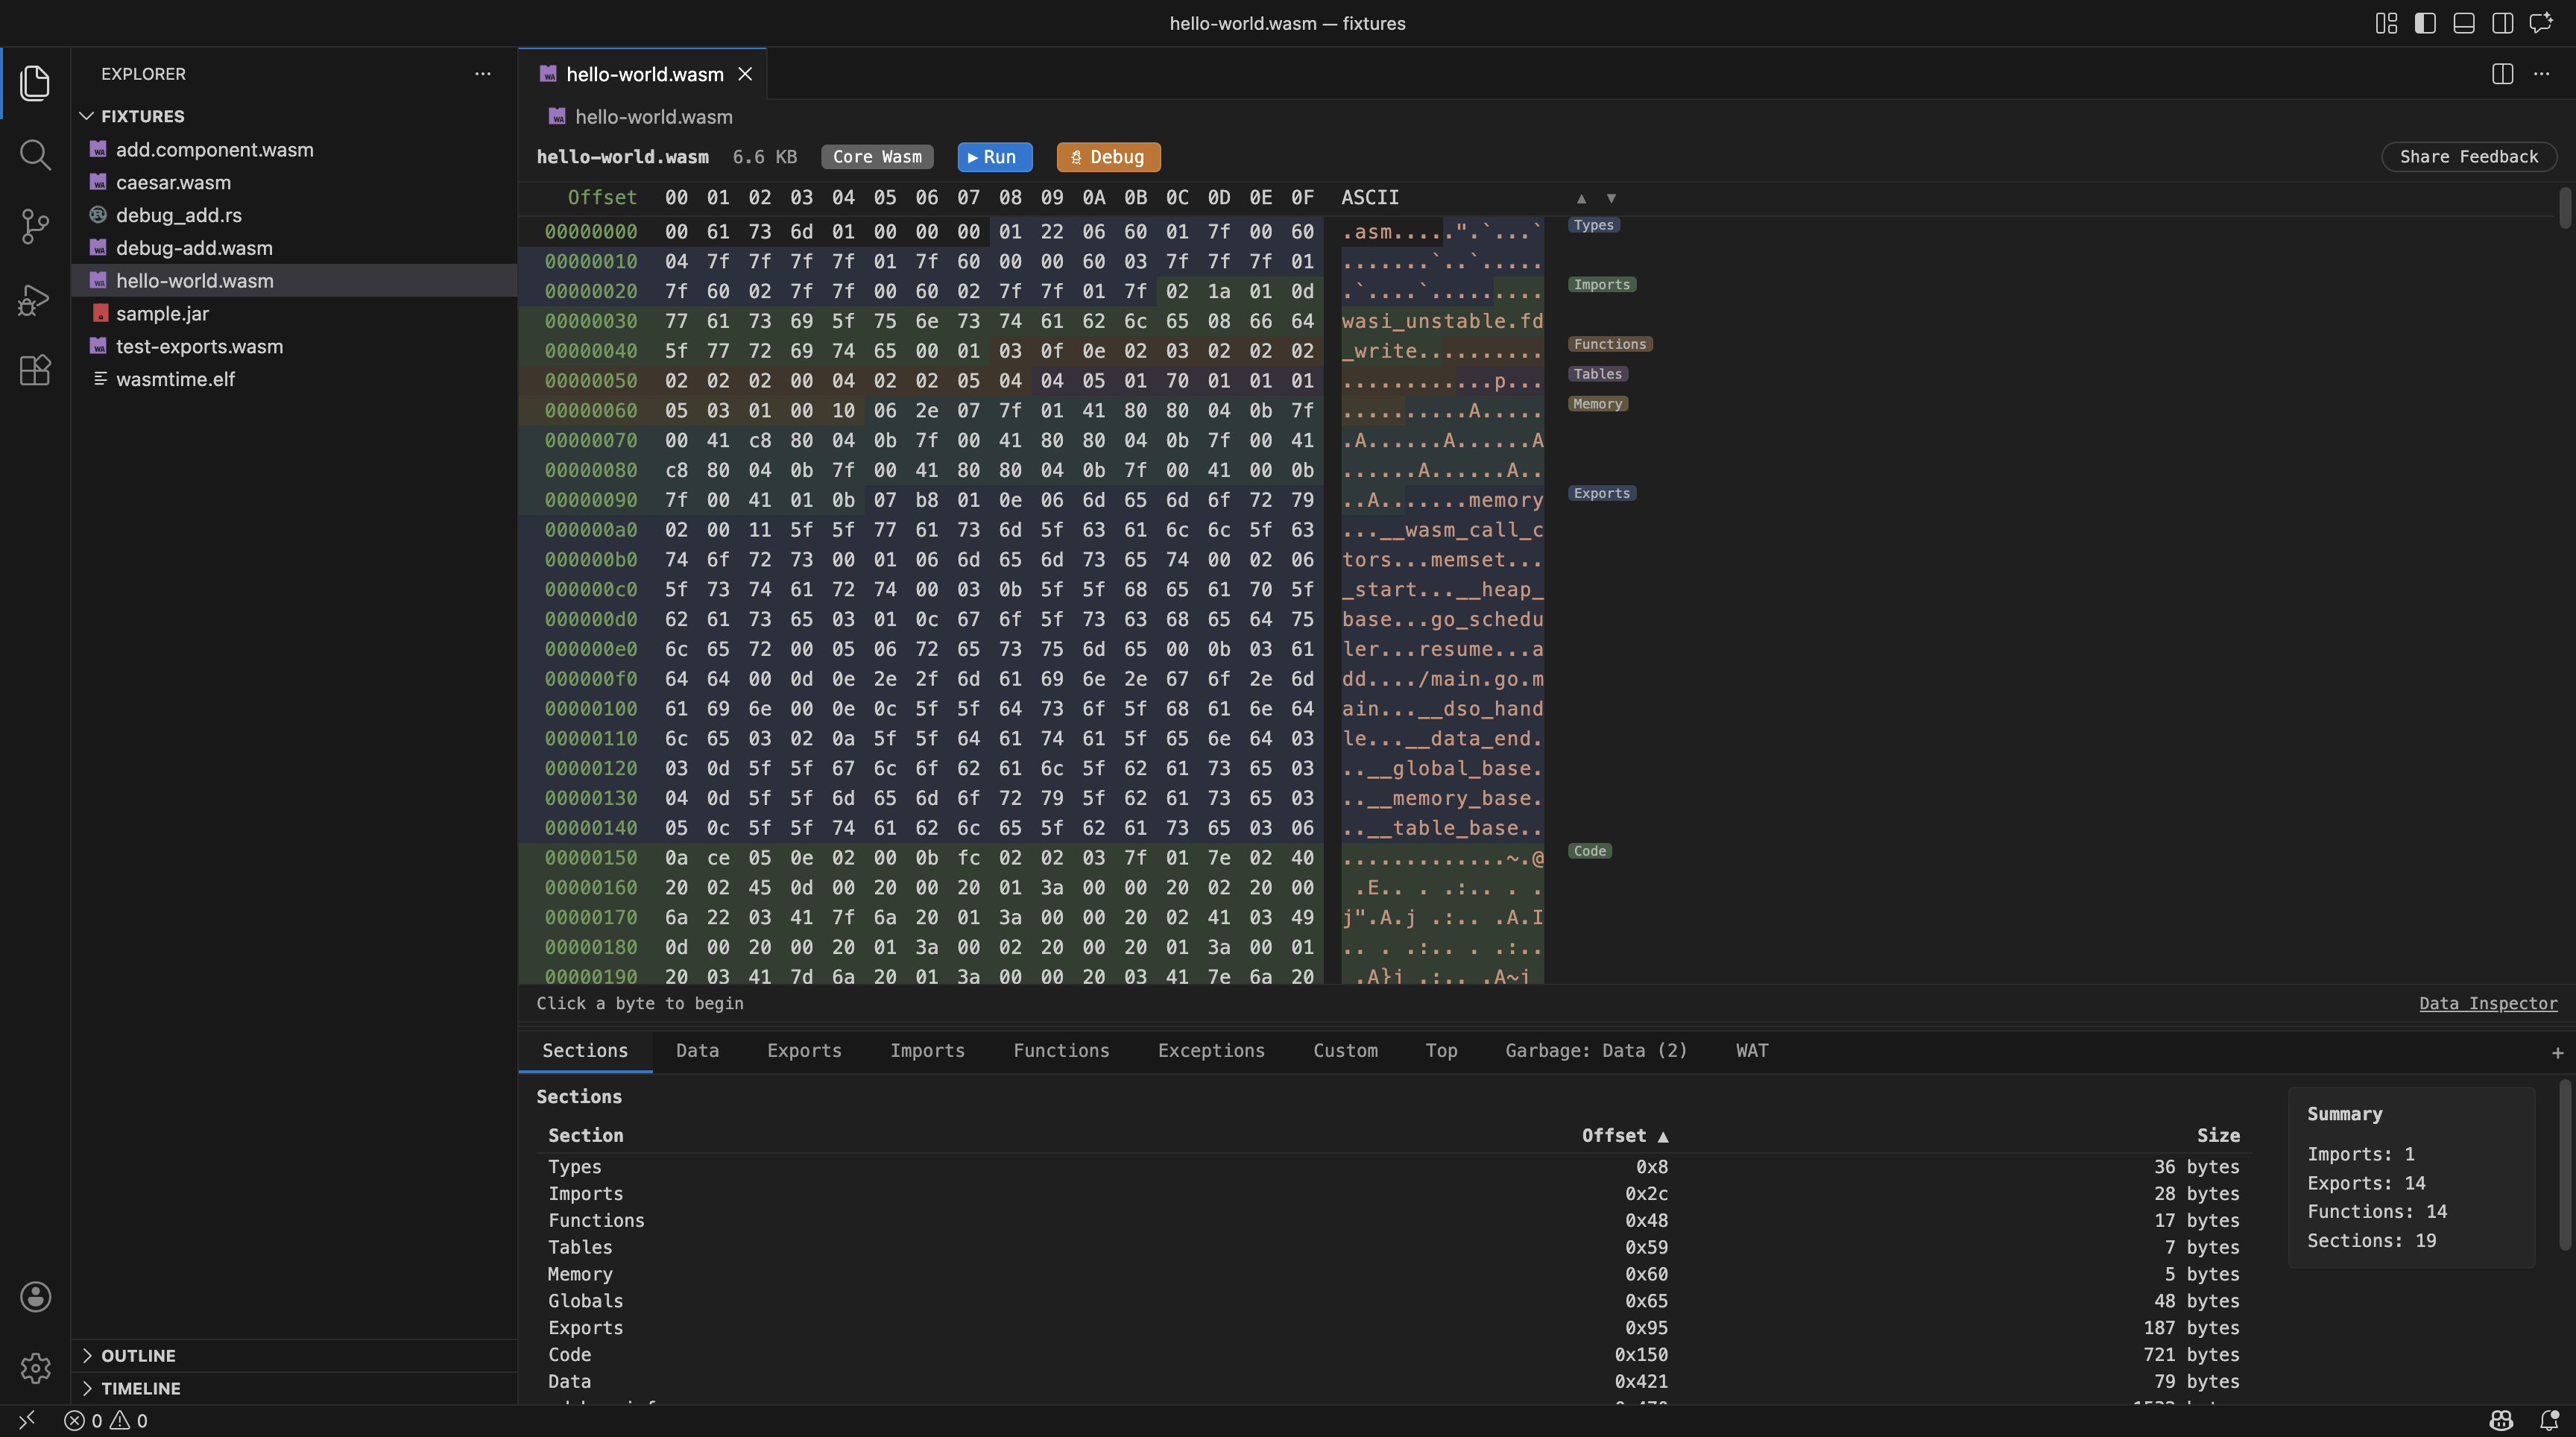
A virtual-scrolling hex dump with:
- Byte selection: click,
Shift+Click, drag. - Keyboard navigation: arrow keys move the caret;
Shift+Arrowextends selection. - Text search (
Cmd/Ctrl+F): incremental search across the hex dump. - Selection status bar: shows the current byte range and decoded interpretations.
- In-place byte editing (0.4.0): overwrite individual bytes and write the result back to the file with the overwrite-file action. Overwrite-only — the file size never changes.
The viewer renders through Compose-for-Web inside a VS Code webview — it scales smoothly to large files without DOM-node-per-byte overhead.
Native binaries (experimental, 0.2.0+)
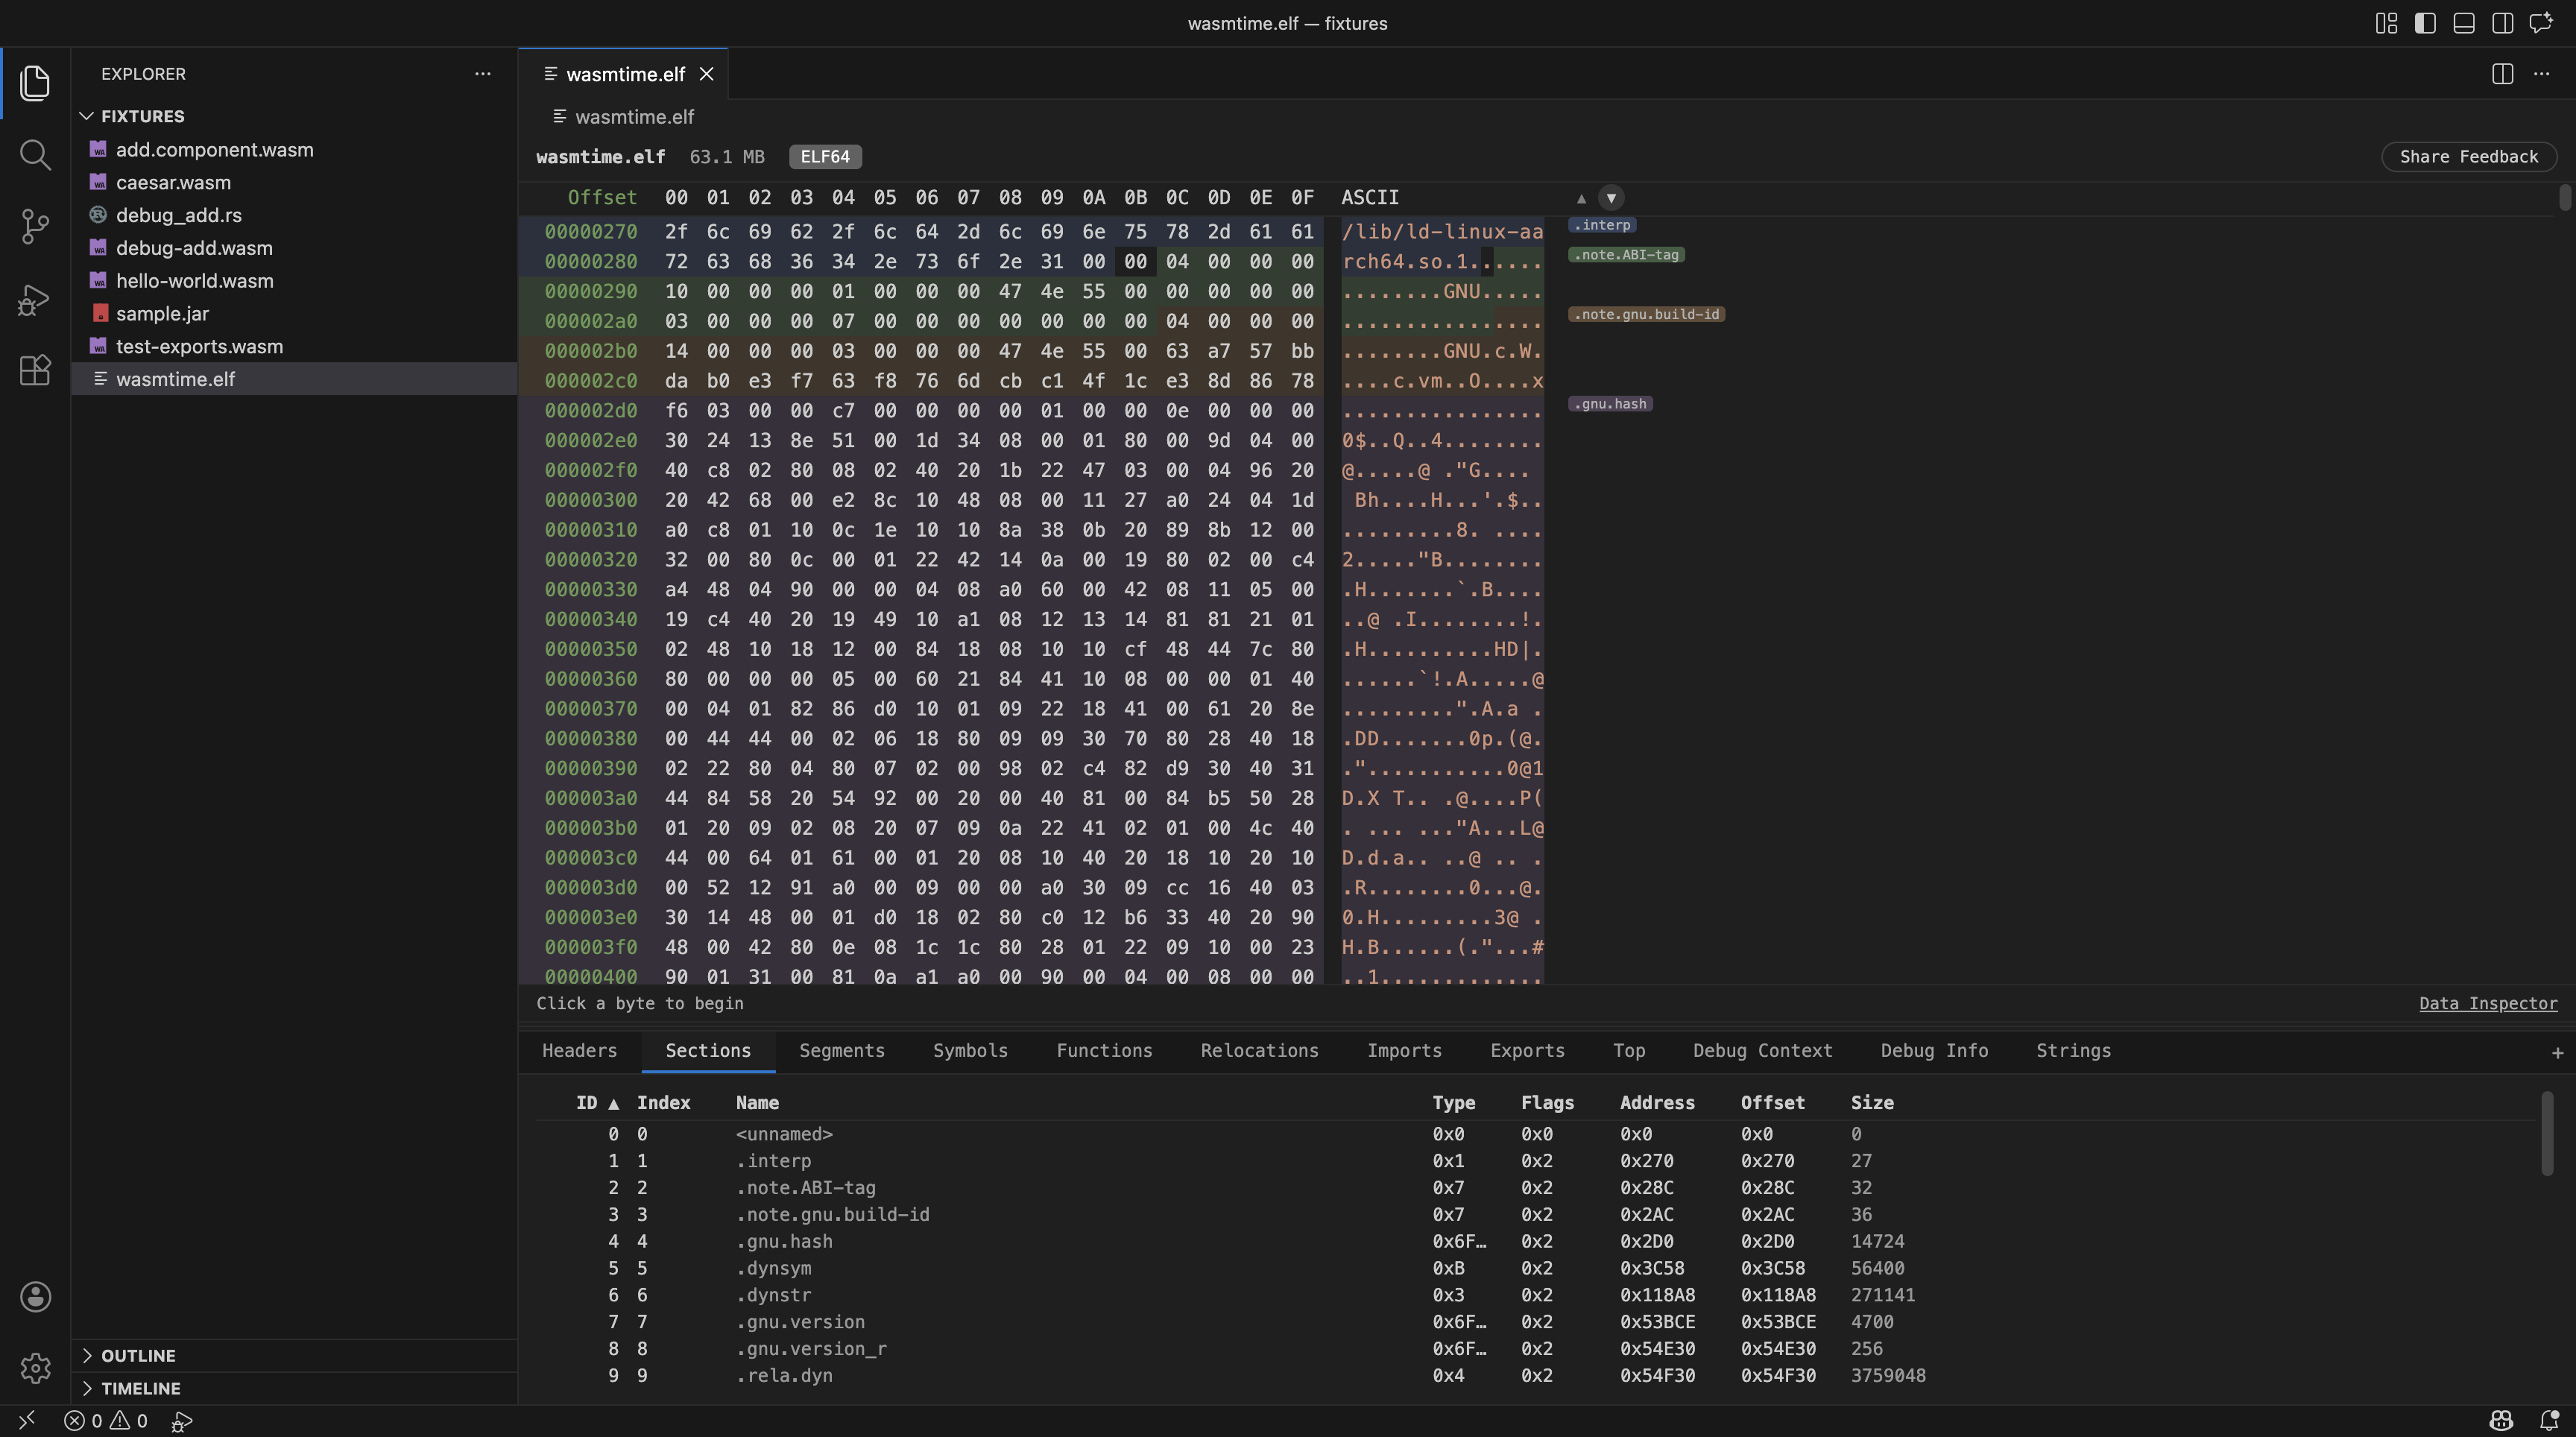
Hexana detects ELF, Mach-O, and PE files by magic bytes and opens them in the same custom editor as .wasm files. The hex viewer behaves identically; the structure tab surfaces format-specific information:
- ELF: sections, segments, dynamic symbols, imports.
- Mach-O: load commands, segments, sections, symbols.
- PE: headers, sections, exports, imports.
Common extensions are recognised (.elf, .so, .dylib, .bundle, .exe, .dll, .sys); extensionless binaries with matching magic bytes also open through the Hexana editor. Run and Debug are not applicable for native binaries.
JVM archives (0.3.0+)
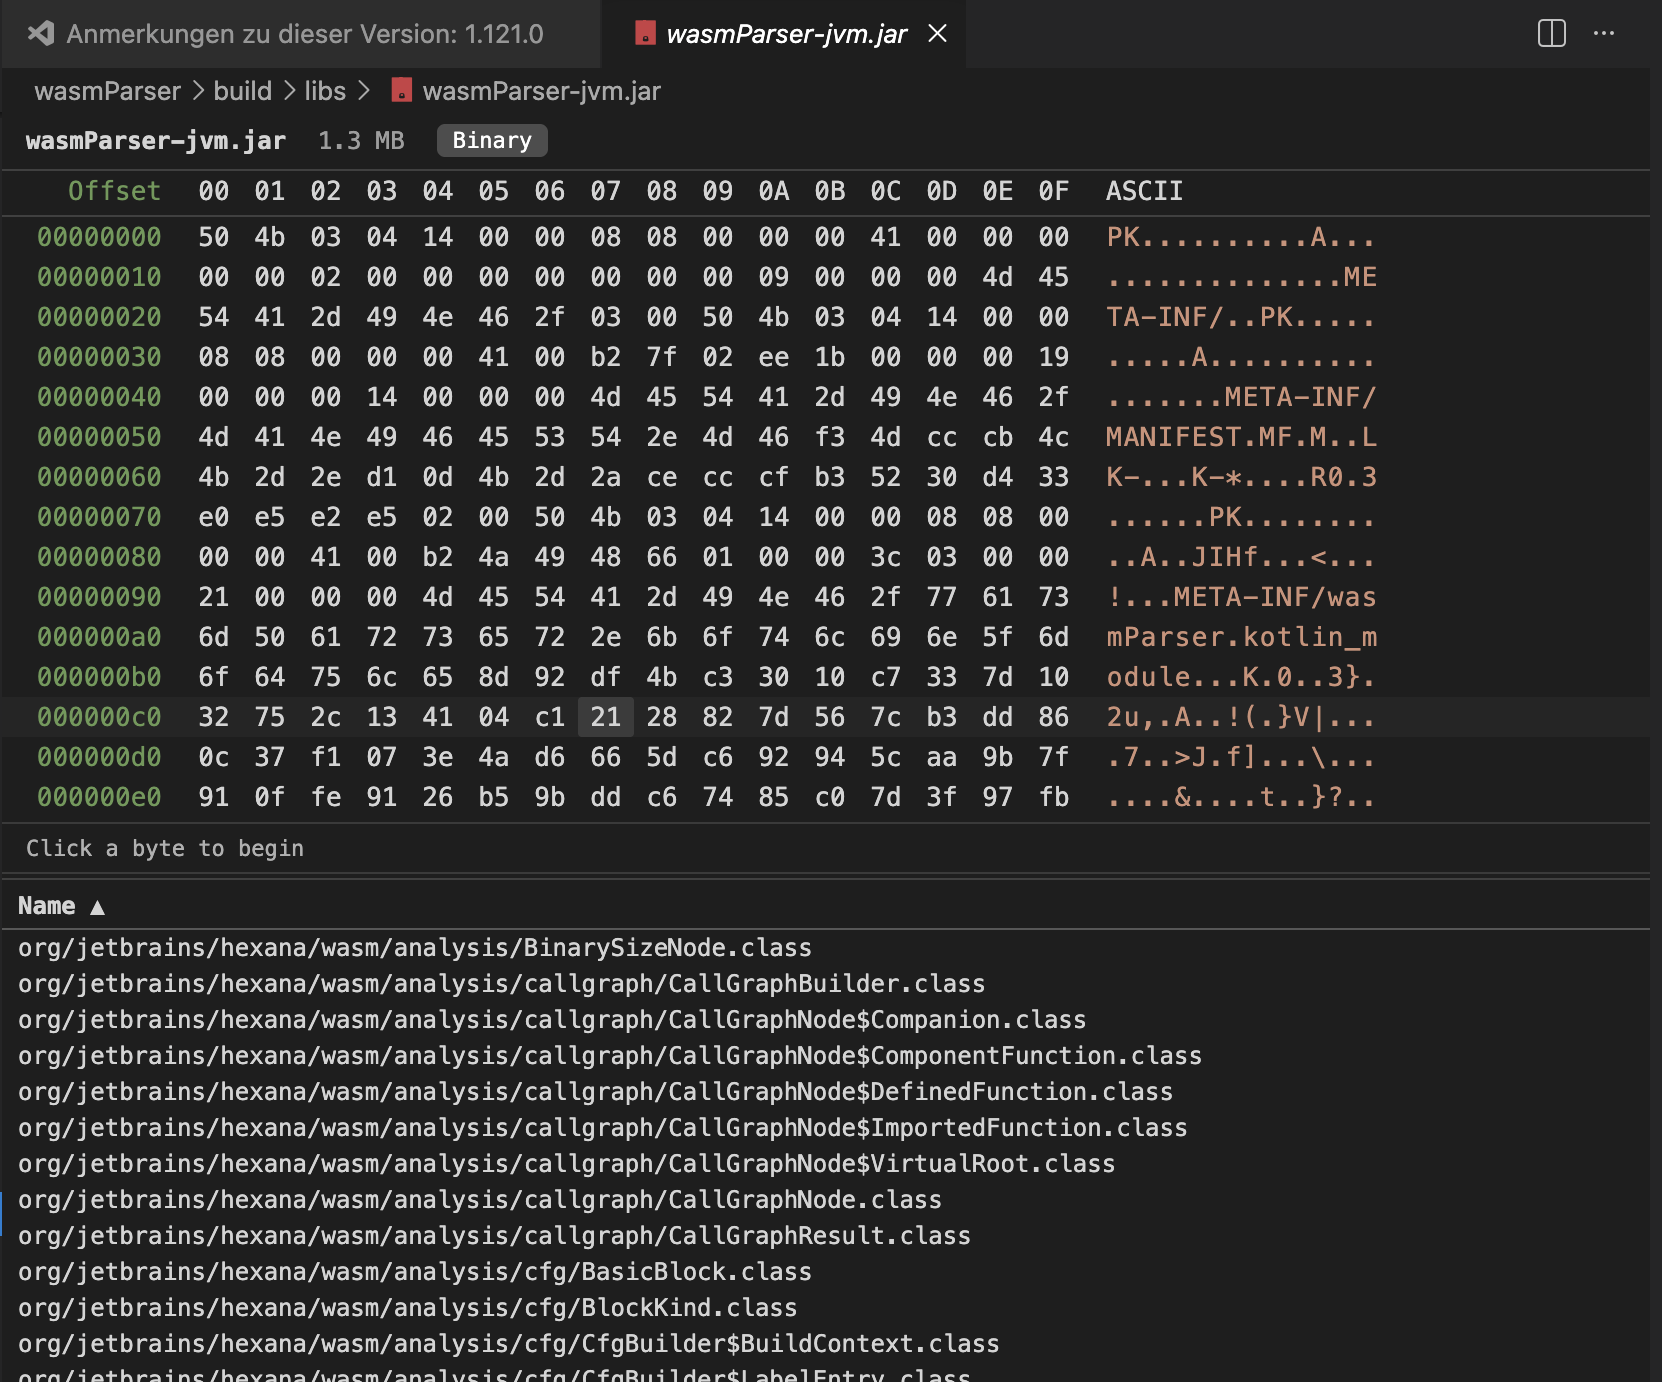
.jar, .zip, .war, and .apk archives open in the Hexana editor with the hex viewer on top and a sortable, searchable entry list below.
- Click an entry that is itself a recognised binary —
.wasm,.class, a native binary, or a nested archive — to open it in a new Hexana editor tab. - Decompression happens in the extension host; entries are read on demand, so large archives open without unpacking everything up front.
- ZIP64 archives (0.5.0) — large archives using the ZIP64 format open without issue.
The decoded three-tab .class view (header / methods / constant pool) remains JetBrains-only — in VS Code a .class entry opens in the hex viewer. See What this version does not do.
Java class files and Android DEX files (0.5.0+)
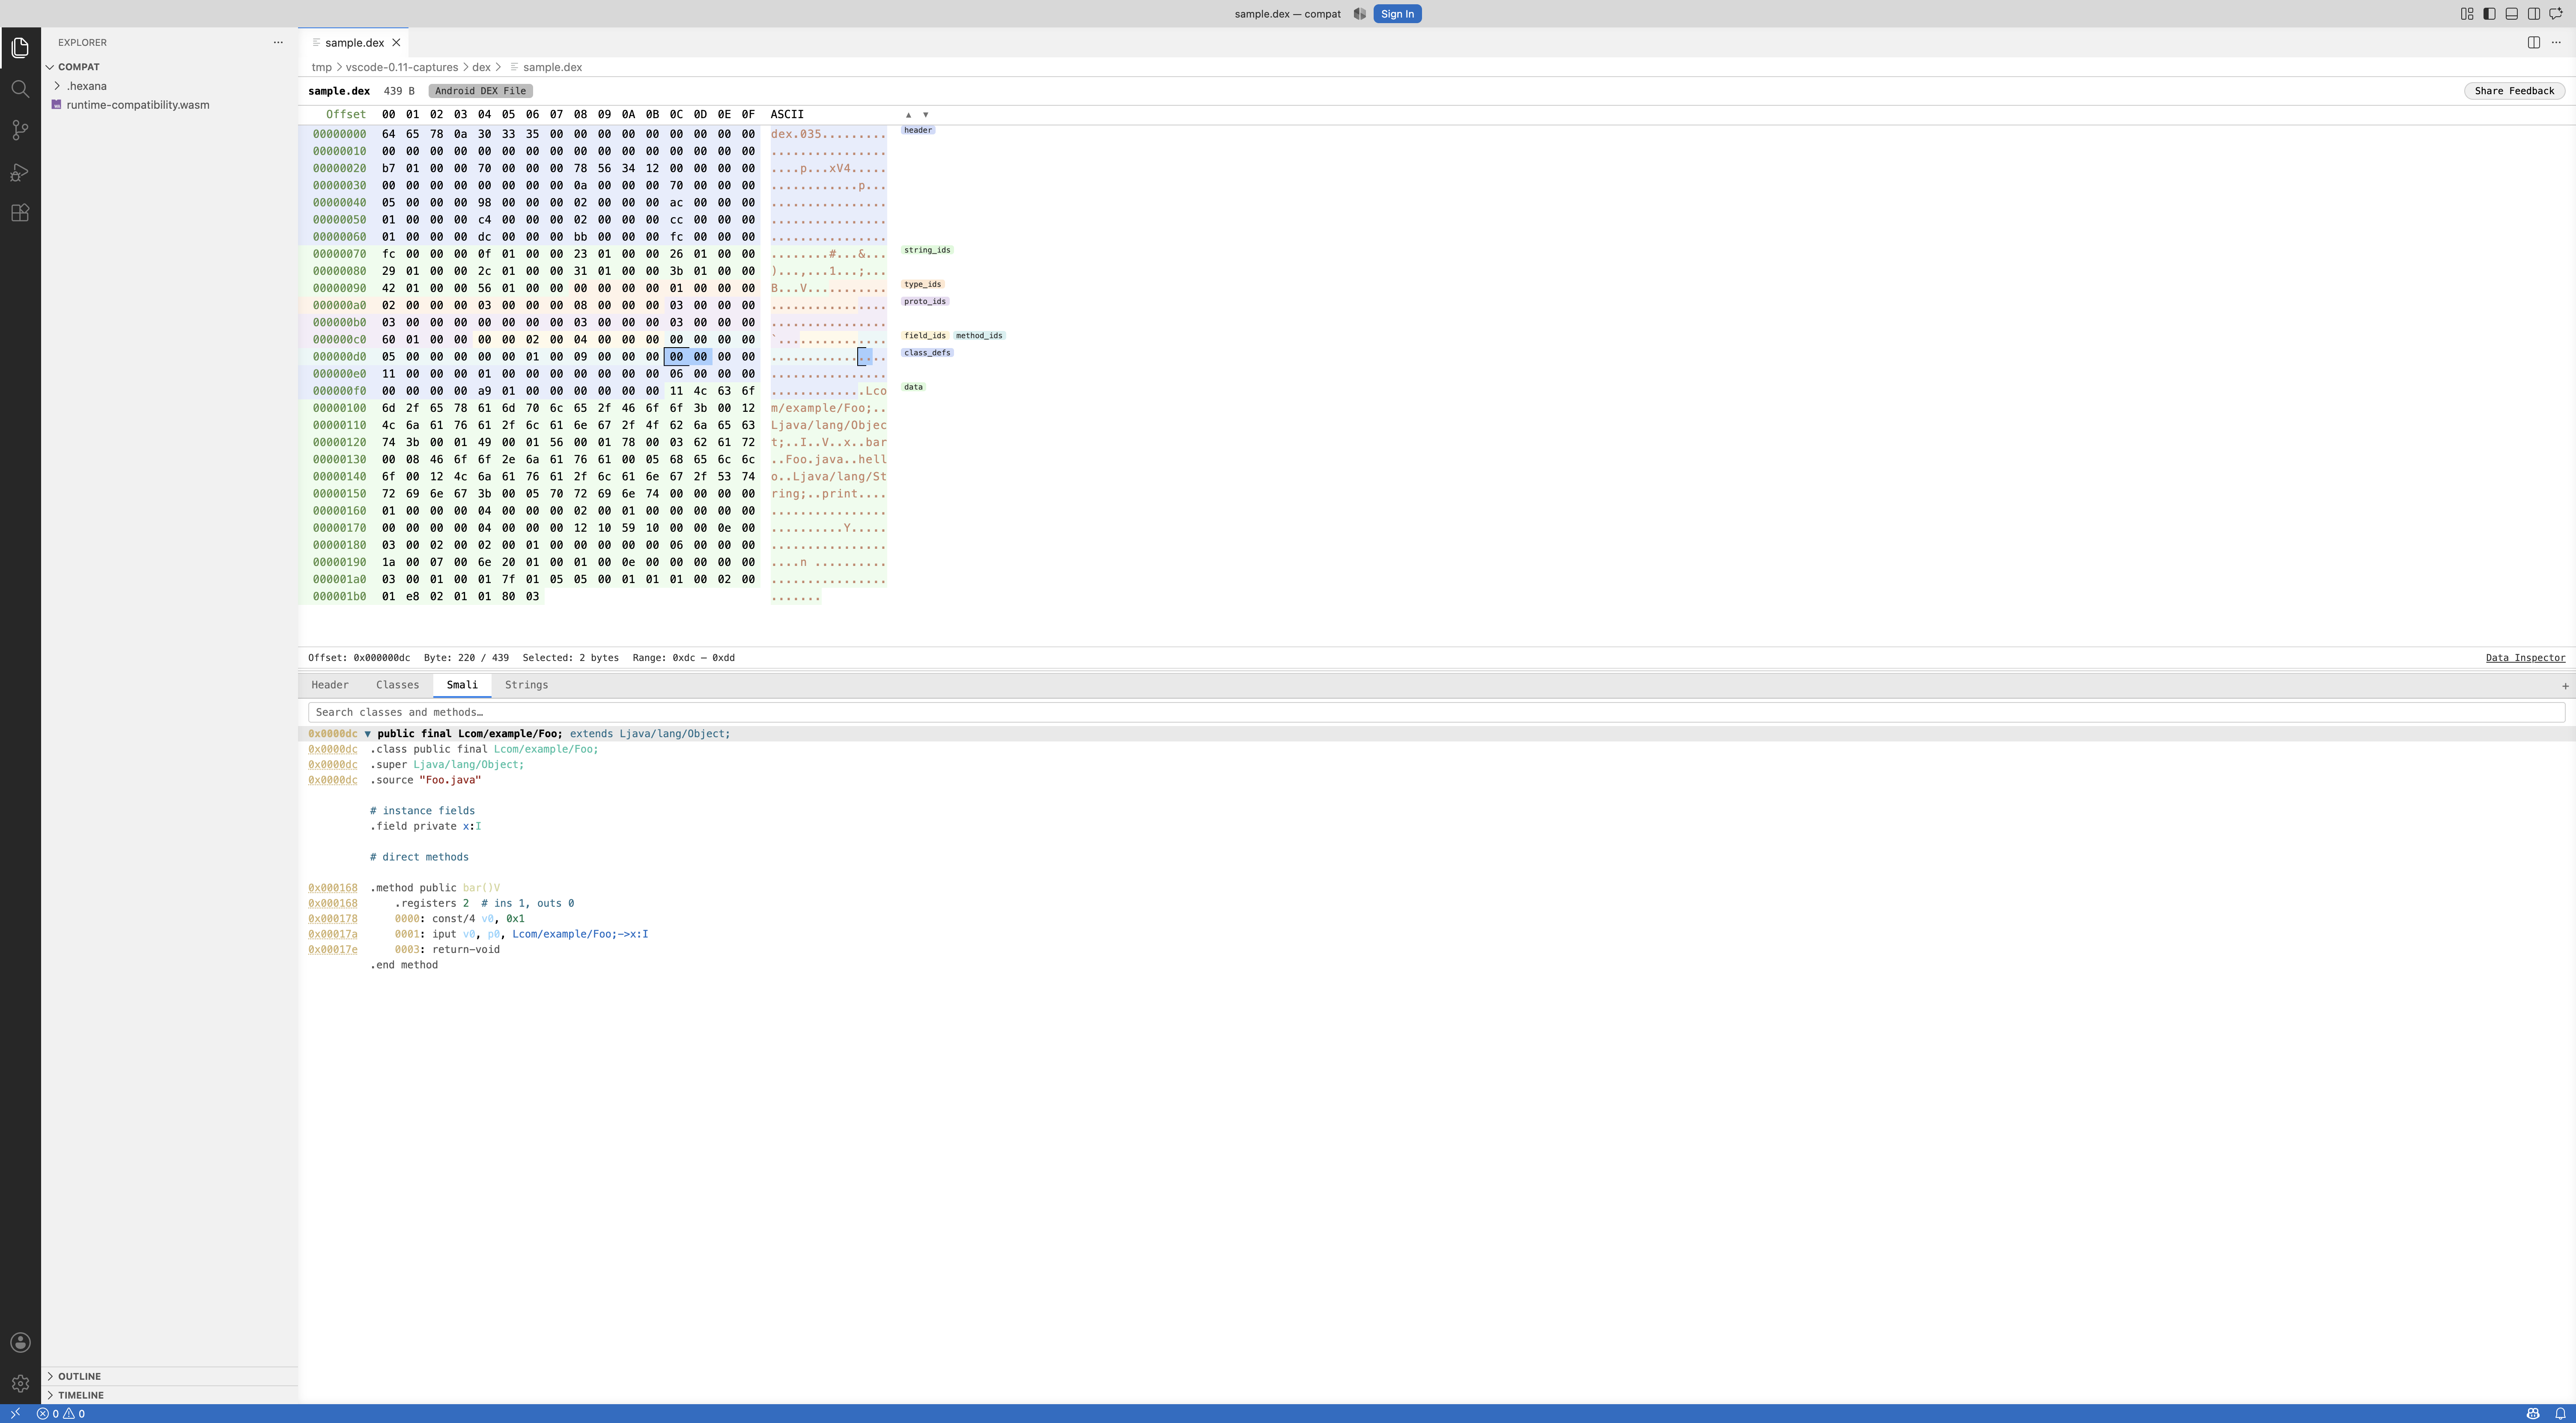
Java .class files and Android DEX (.dex) files open directly in the Hexana custom editor by file-type detection, without needing to be inside a JAR or ZIP archive. Both formats open in the hex viewer. The full decoded class view (header / methods / constant pool) — available in the JetBrains plugin — is not present in the VS Code extension. See What this version does not do.
Since 0.11.0, .dex files have a Smali tab showing baksmali-style Dalvik bytecode with resolved operands. Clicking a row selects the corresponding code unit in the hex view.
Since 0.11.0, Android binary resource tables (resources.arsc) have basic viewing support.
Protocol Buffers files (0.6.0+, 0.12.0+)
Compiled Protocol Buffers descriptor sets — .desc and .protoset files, as produced by protoc --descriptor_set_out — open in the Hexana custom editor with five dedicated tabs:
| Tab | Contents |
|---|---|
| Files | Each embedded .proto file with its package, syntax, message / enum / service counts, and dependencies. |
| Messages | All message types with dotted qualified names (Outer.Inner), plus field, nested-type, and enum counts. |
| Fields | Every field across all messages: field number, label, type, and any message or enum type reference. |
| Enums | Enum values with their names and numbers, grouped by qualified enum name. |
| Services | Each RPC method with its input and output types and client / server streaming flags. |
This is useful for inspecting what a compiled API surface actually contains, particularly when the source .proto files are not available.
Since 0.12.0, opaque Protobuf wire messages (.pb files) are also decoded without a schema. The decoded view shows each field's path, type, and value.
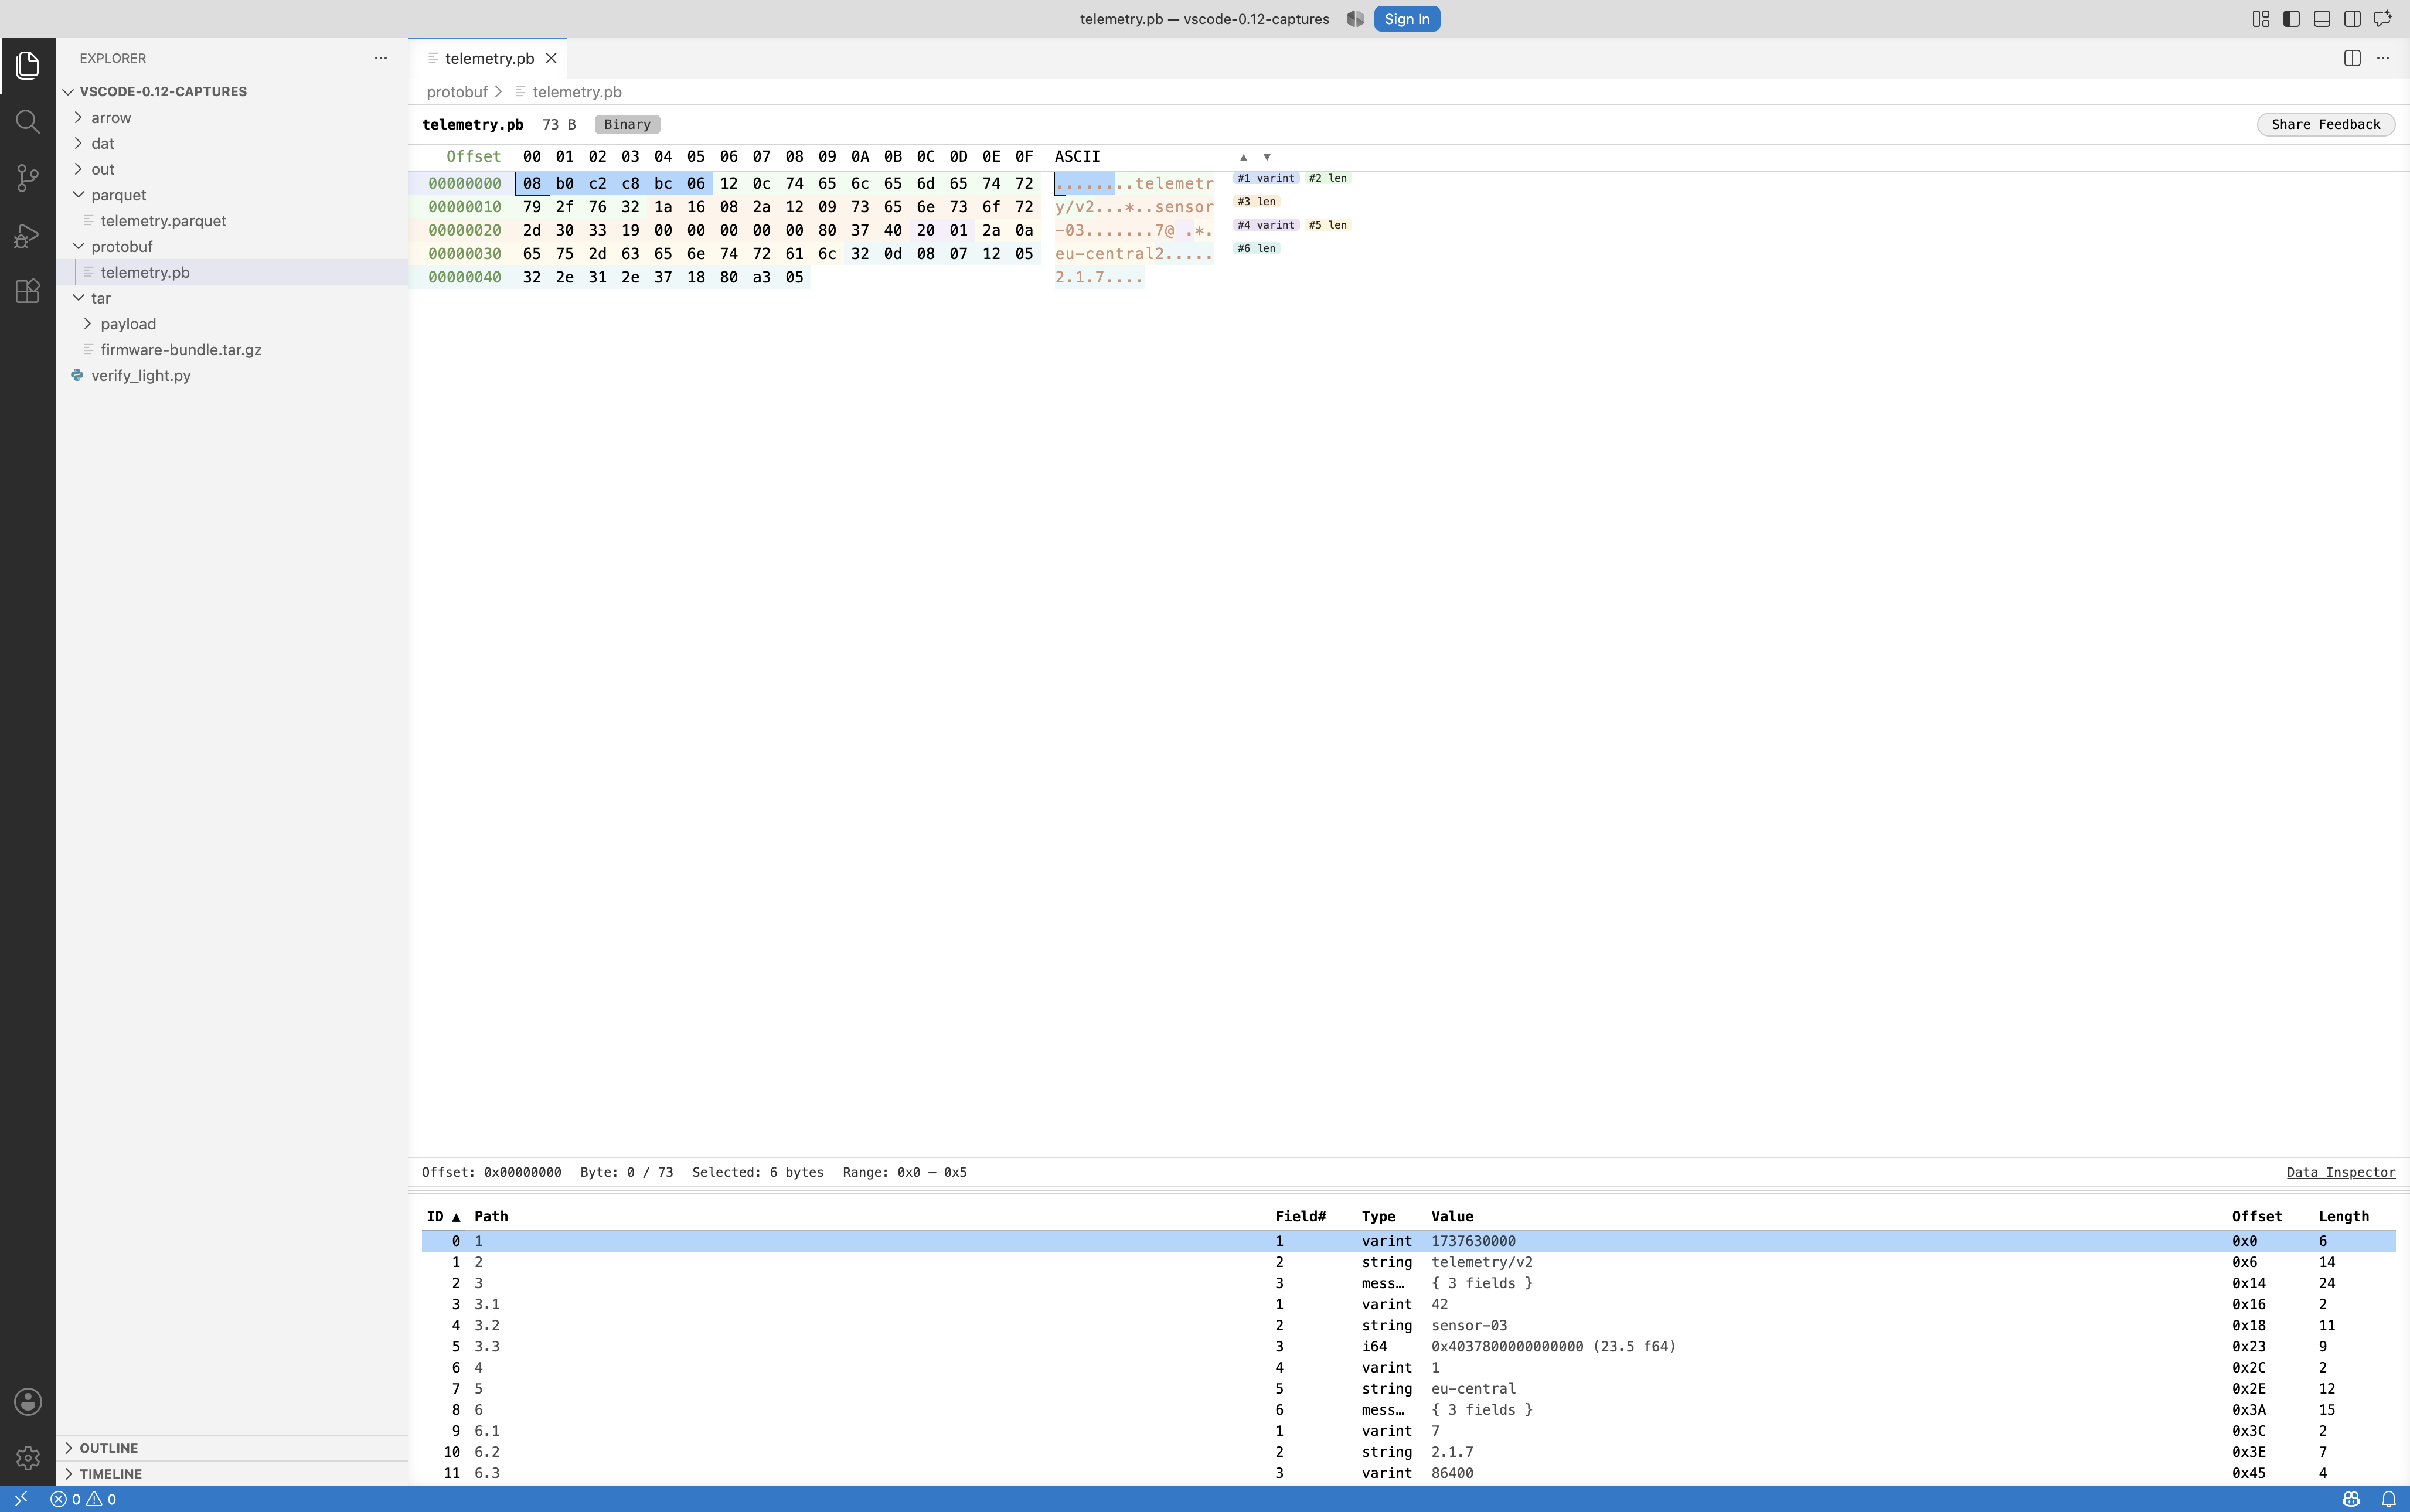
Apache Parquet and Apache Arrow (0.12.0+)
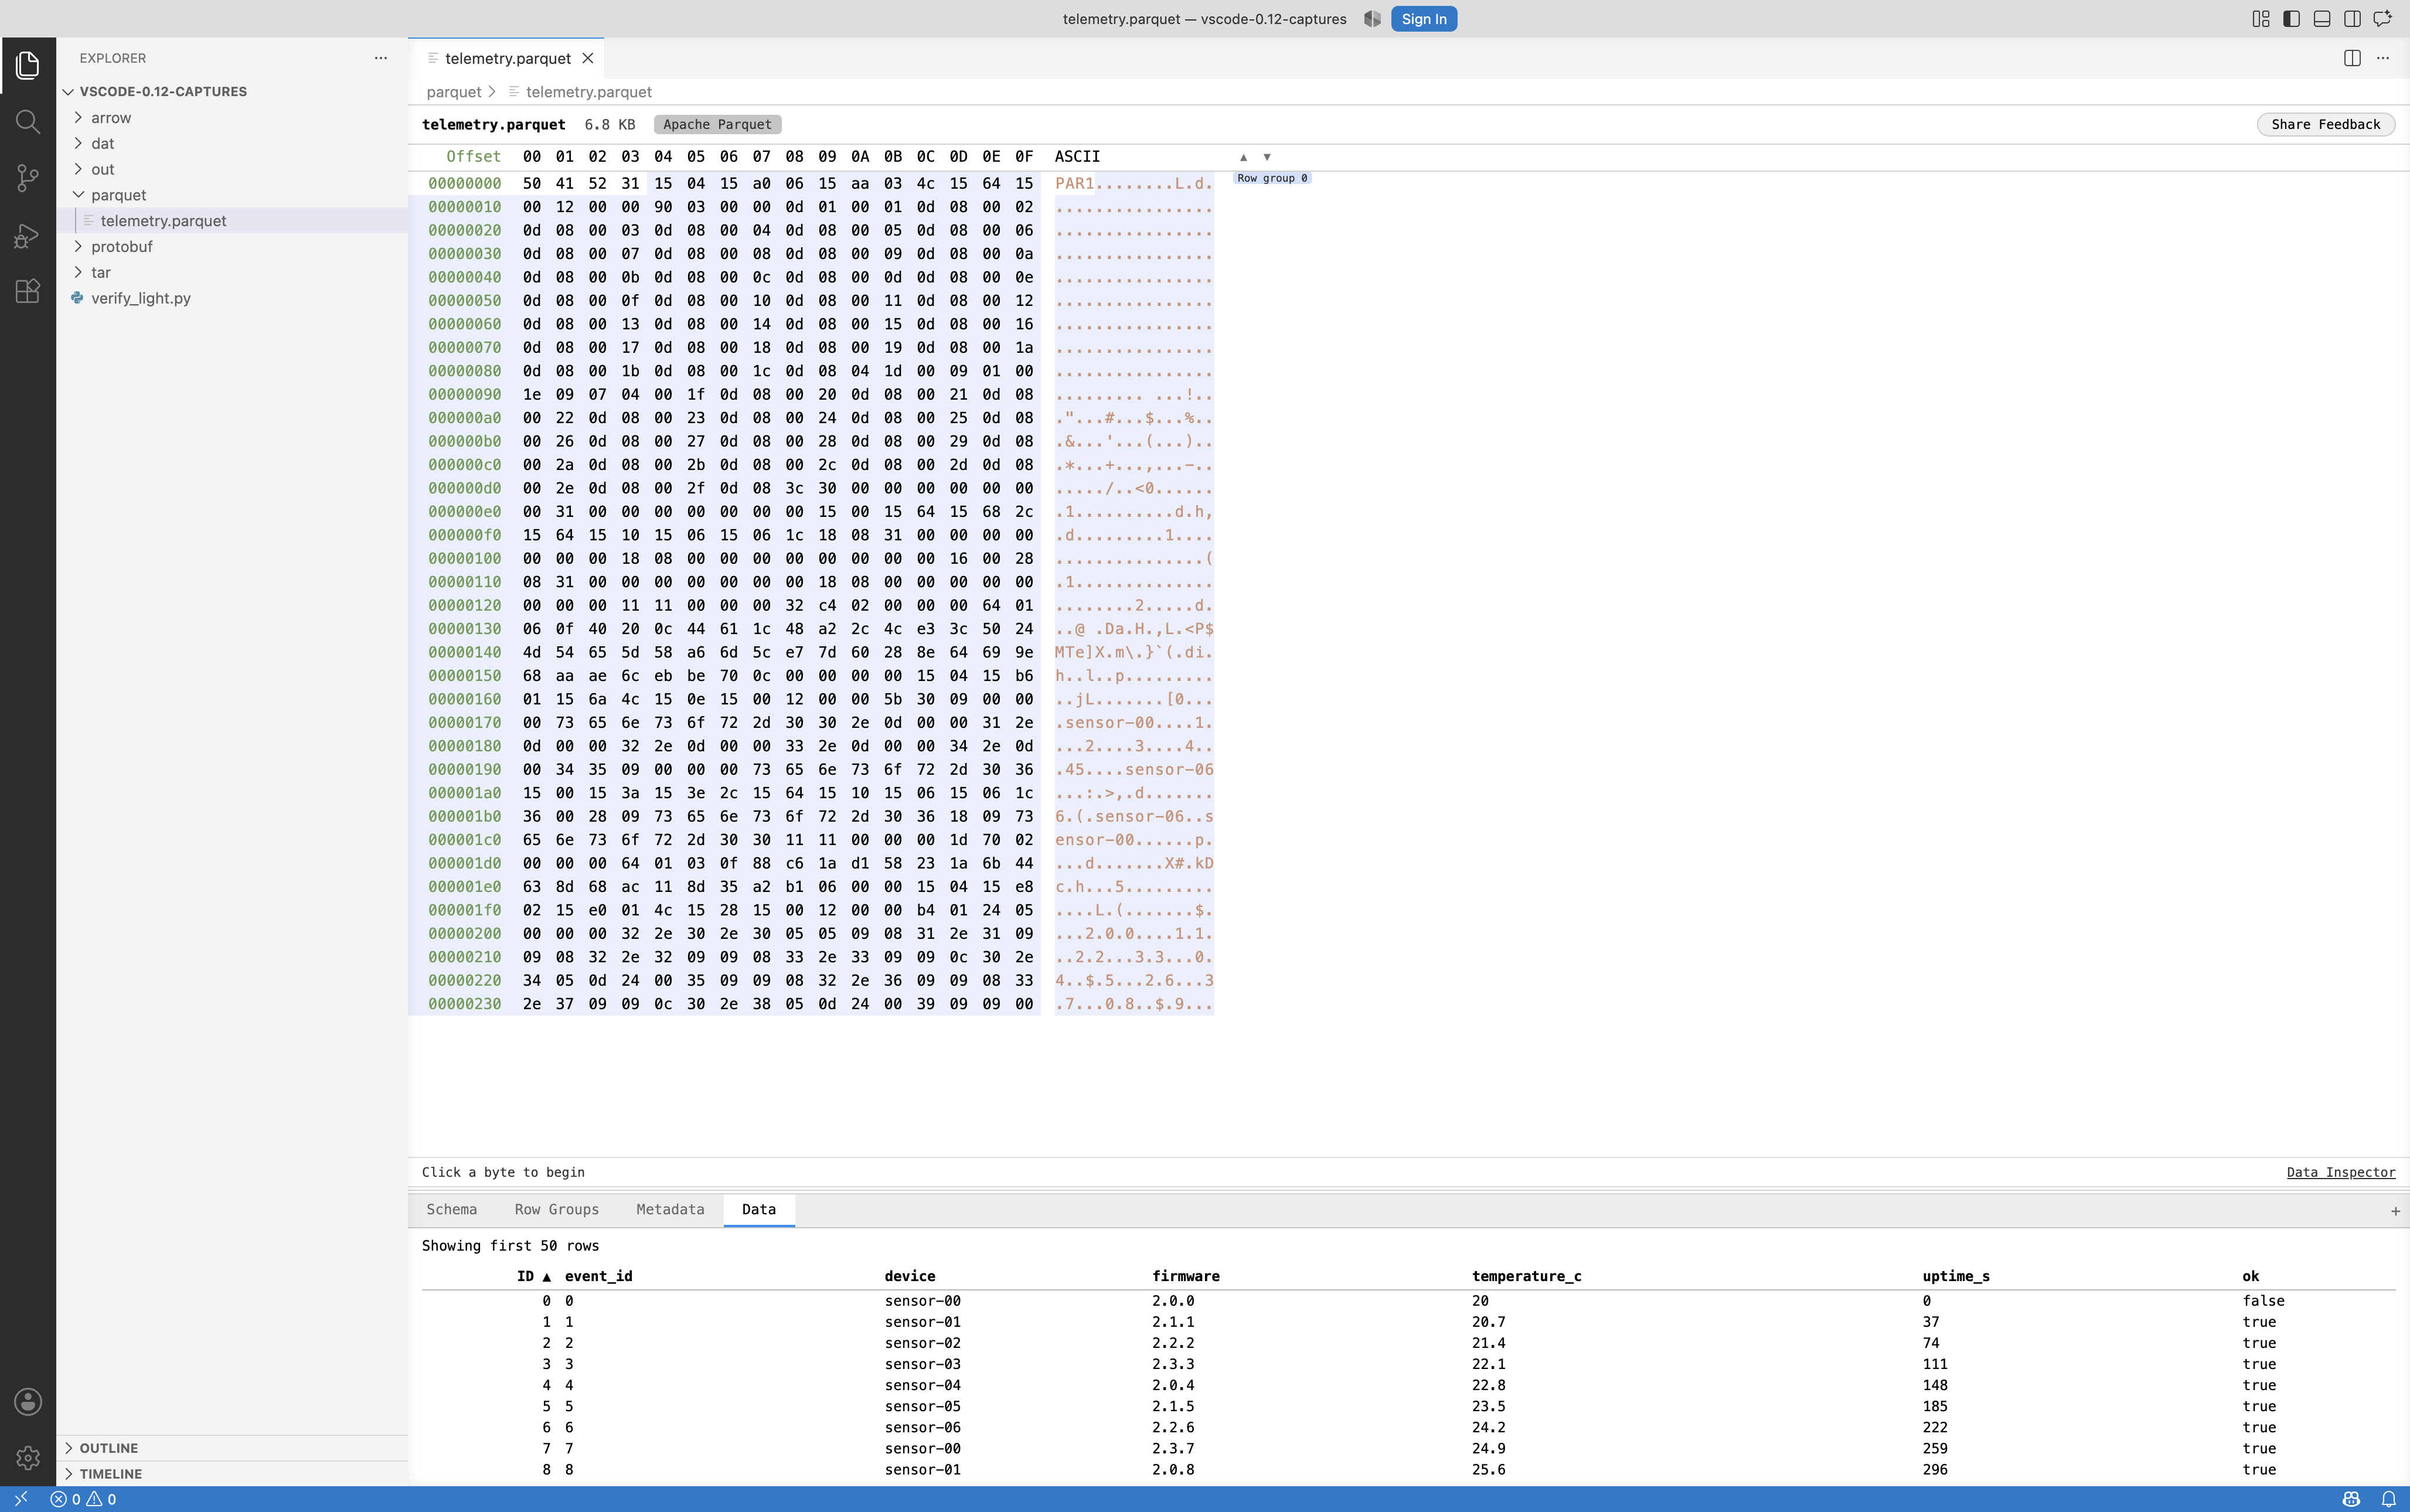
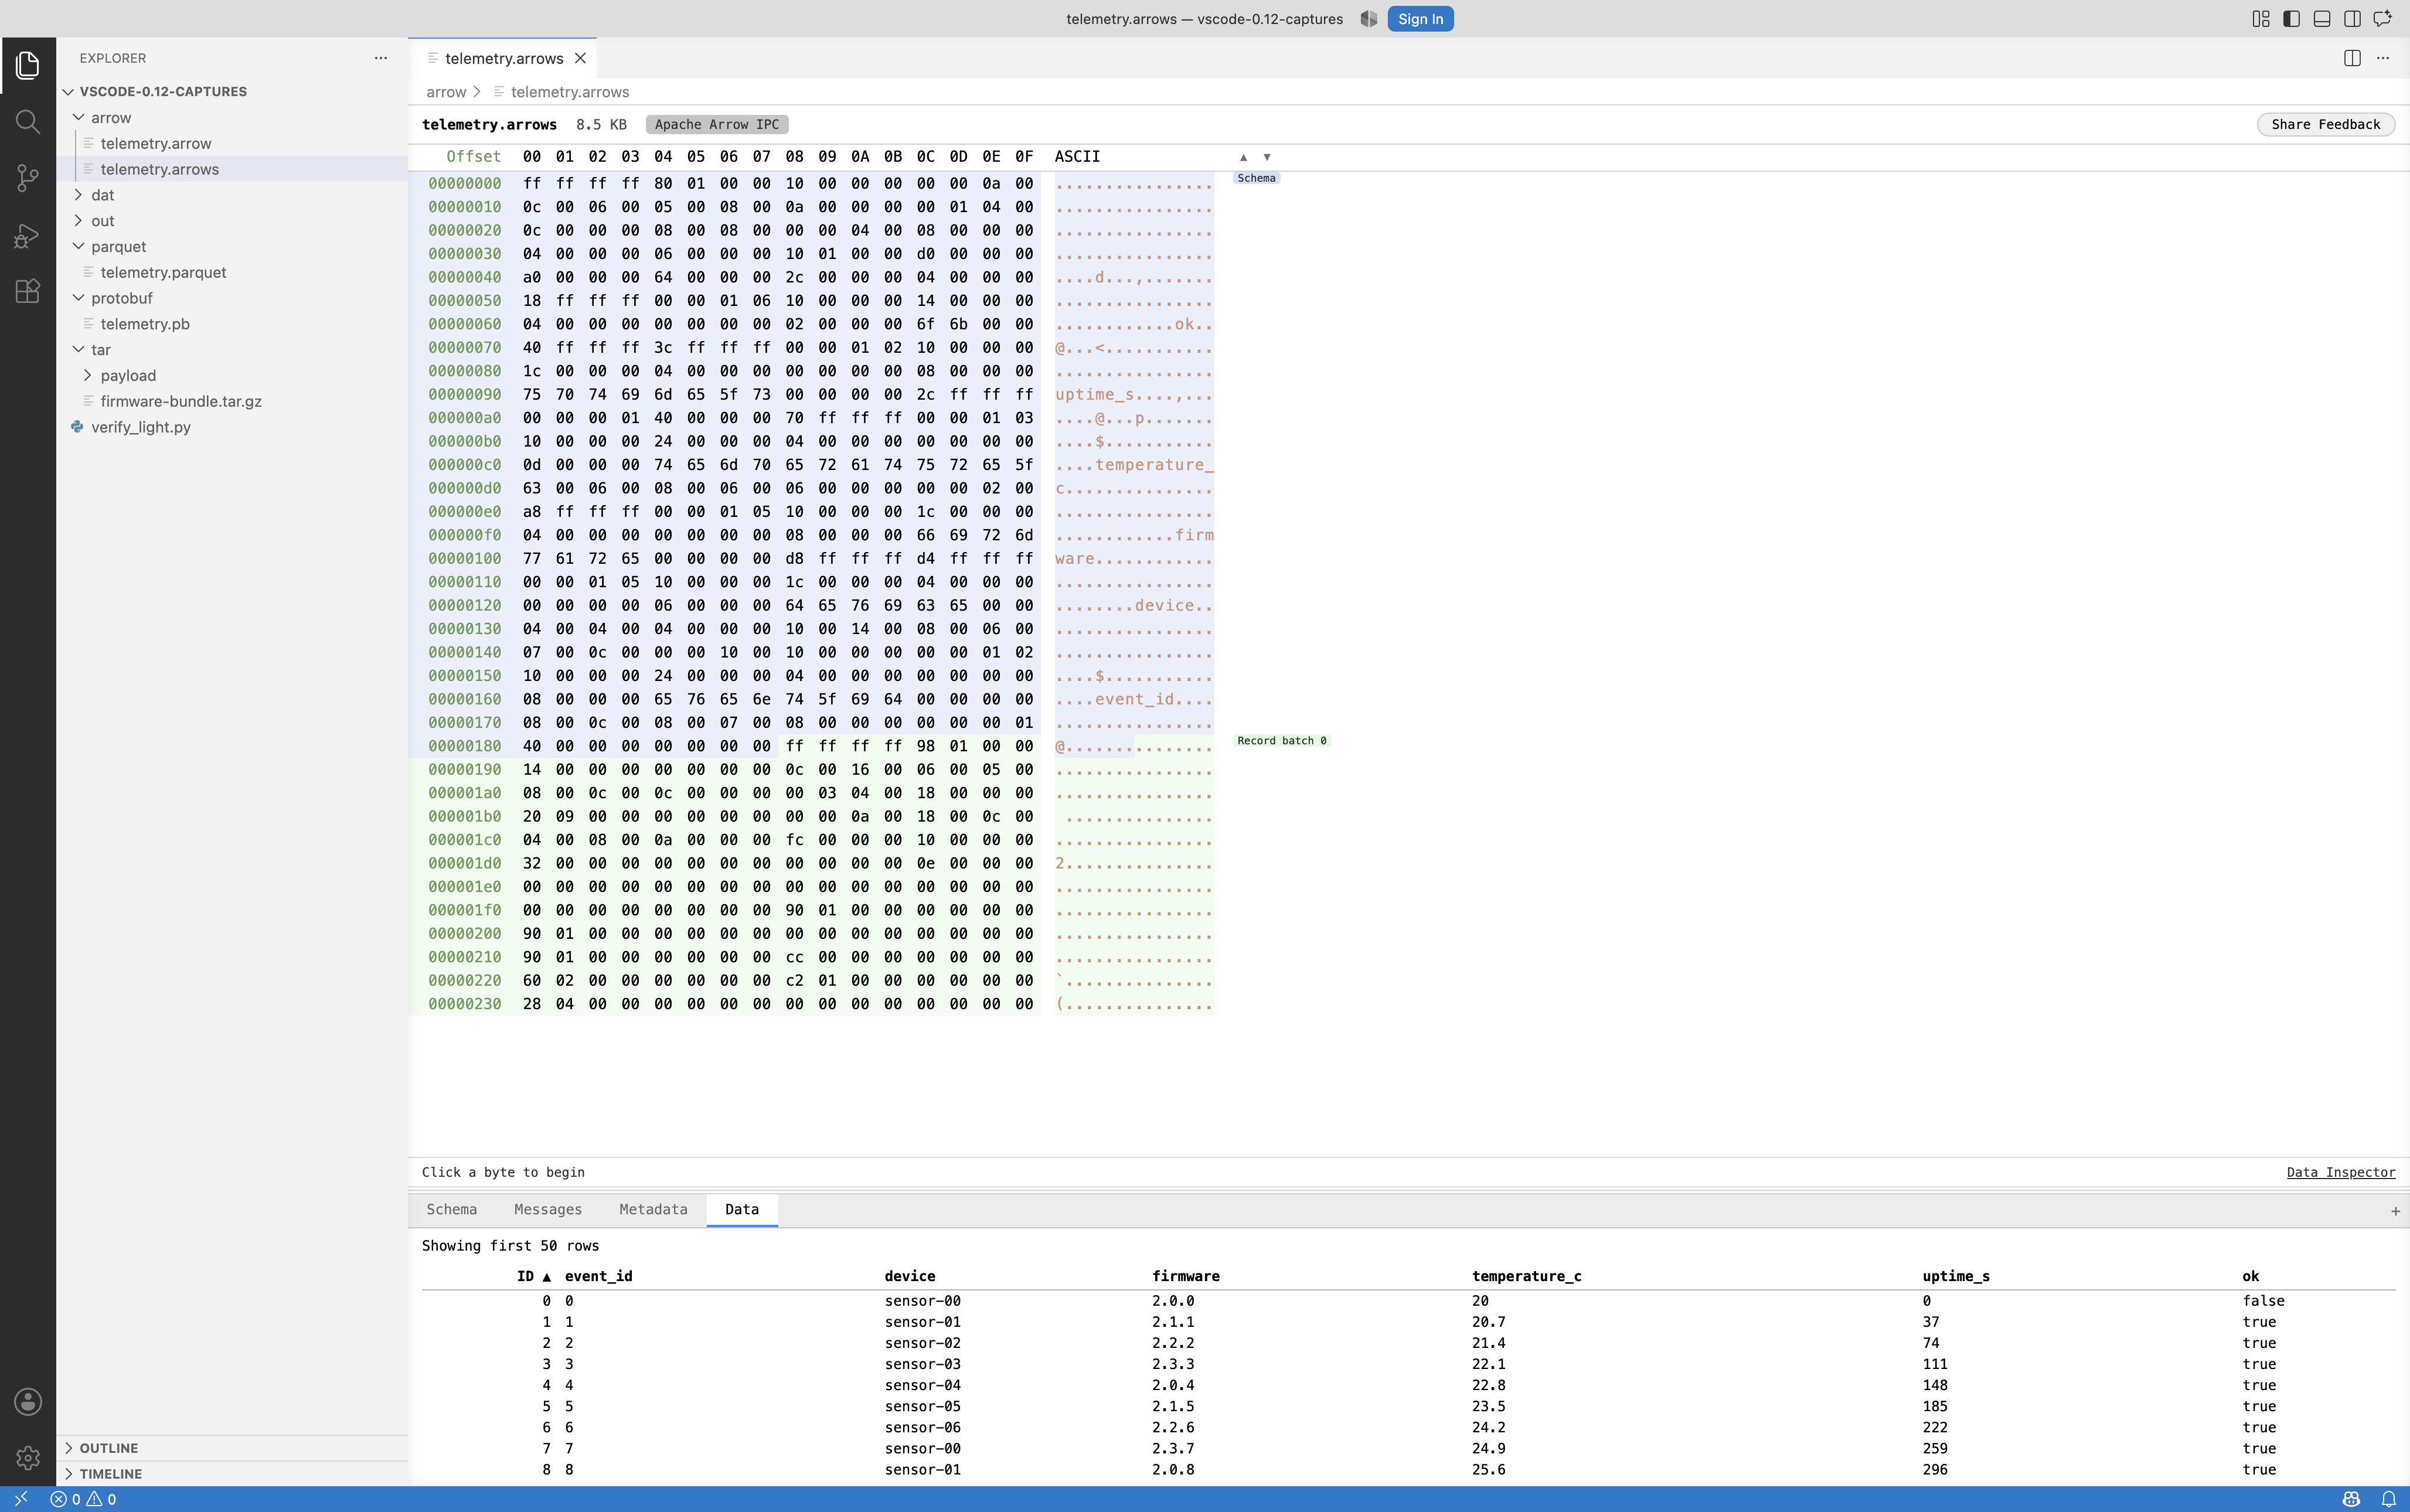
Apache Parquet (.parquet) and Apache Arrow IPC (.arrow, .arrows) files open with four dedicated tabs: Schema, Row Groups (Parquet) or Record Batches (Arrow), Metadata, and Data.
Arrow IPC streams open as streams (conventionally .arrows). Previously every .arrow file was read as an IPC file, so a stream showed no tabs.
Tar archives (0.12.0+)
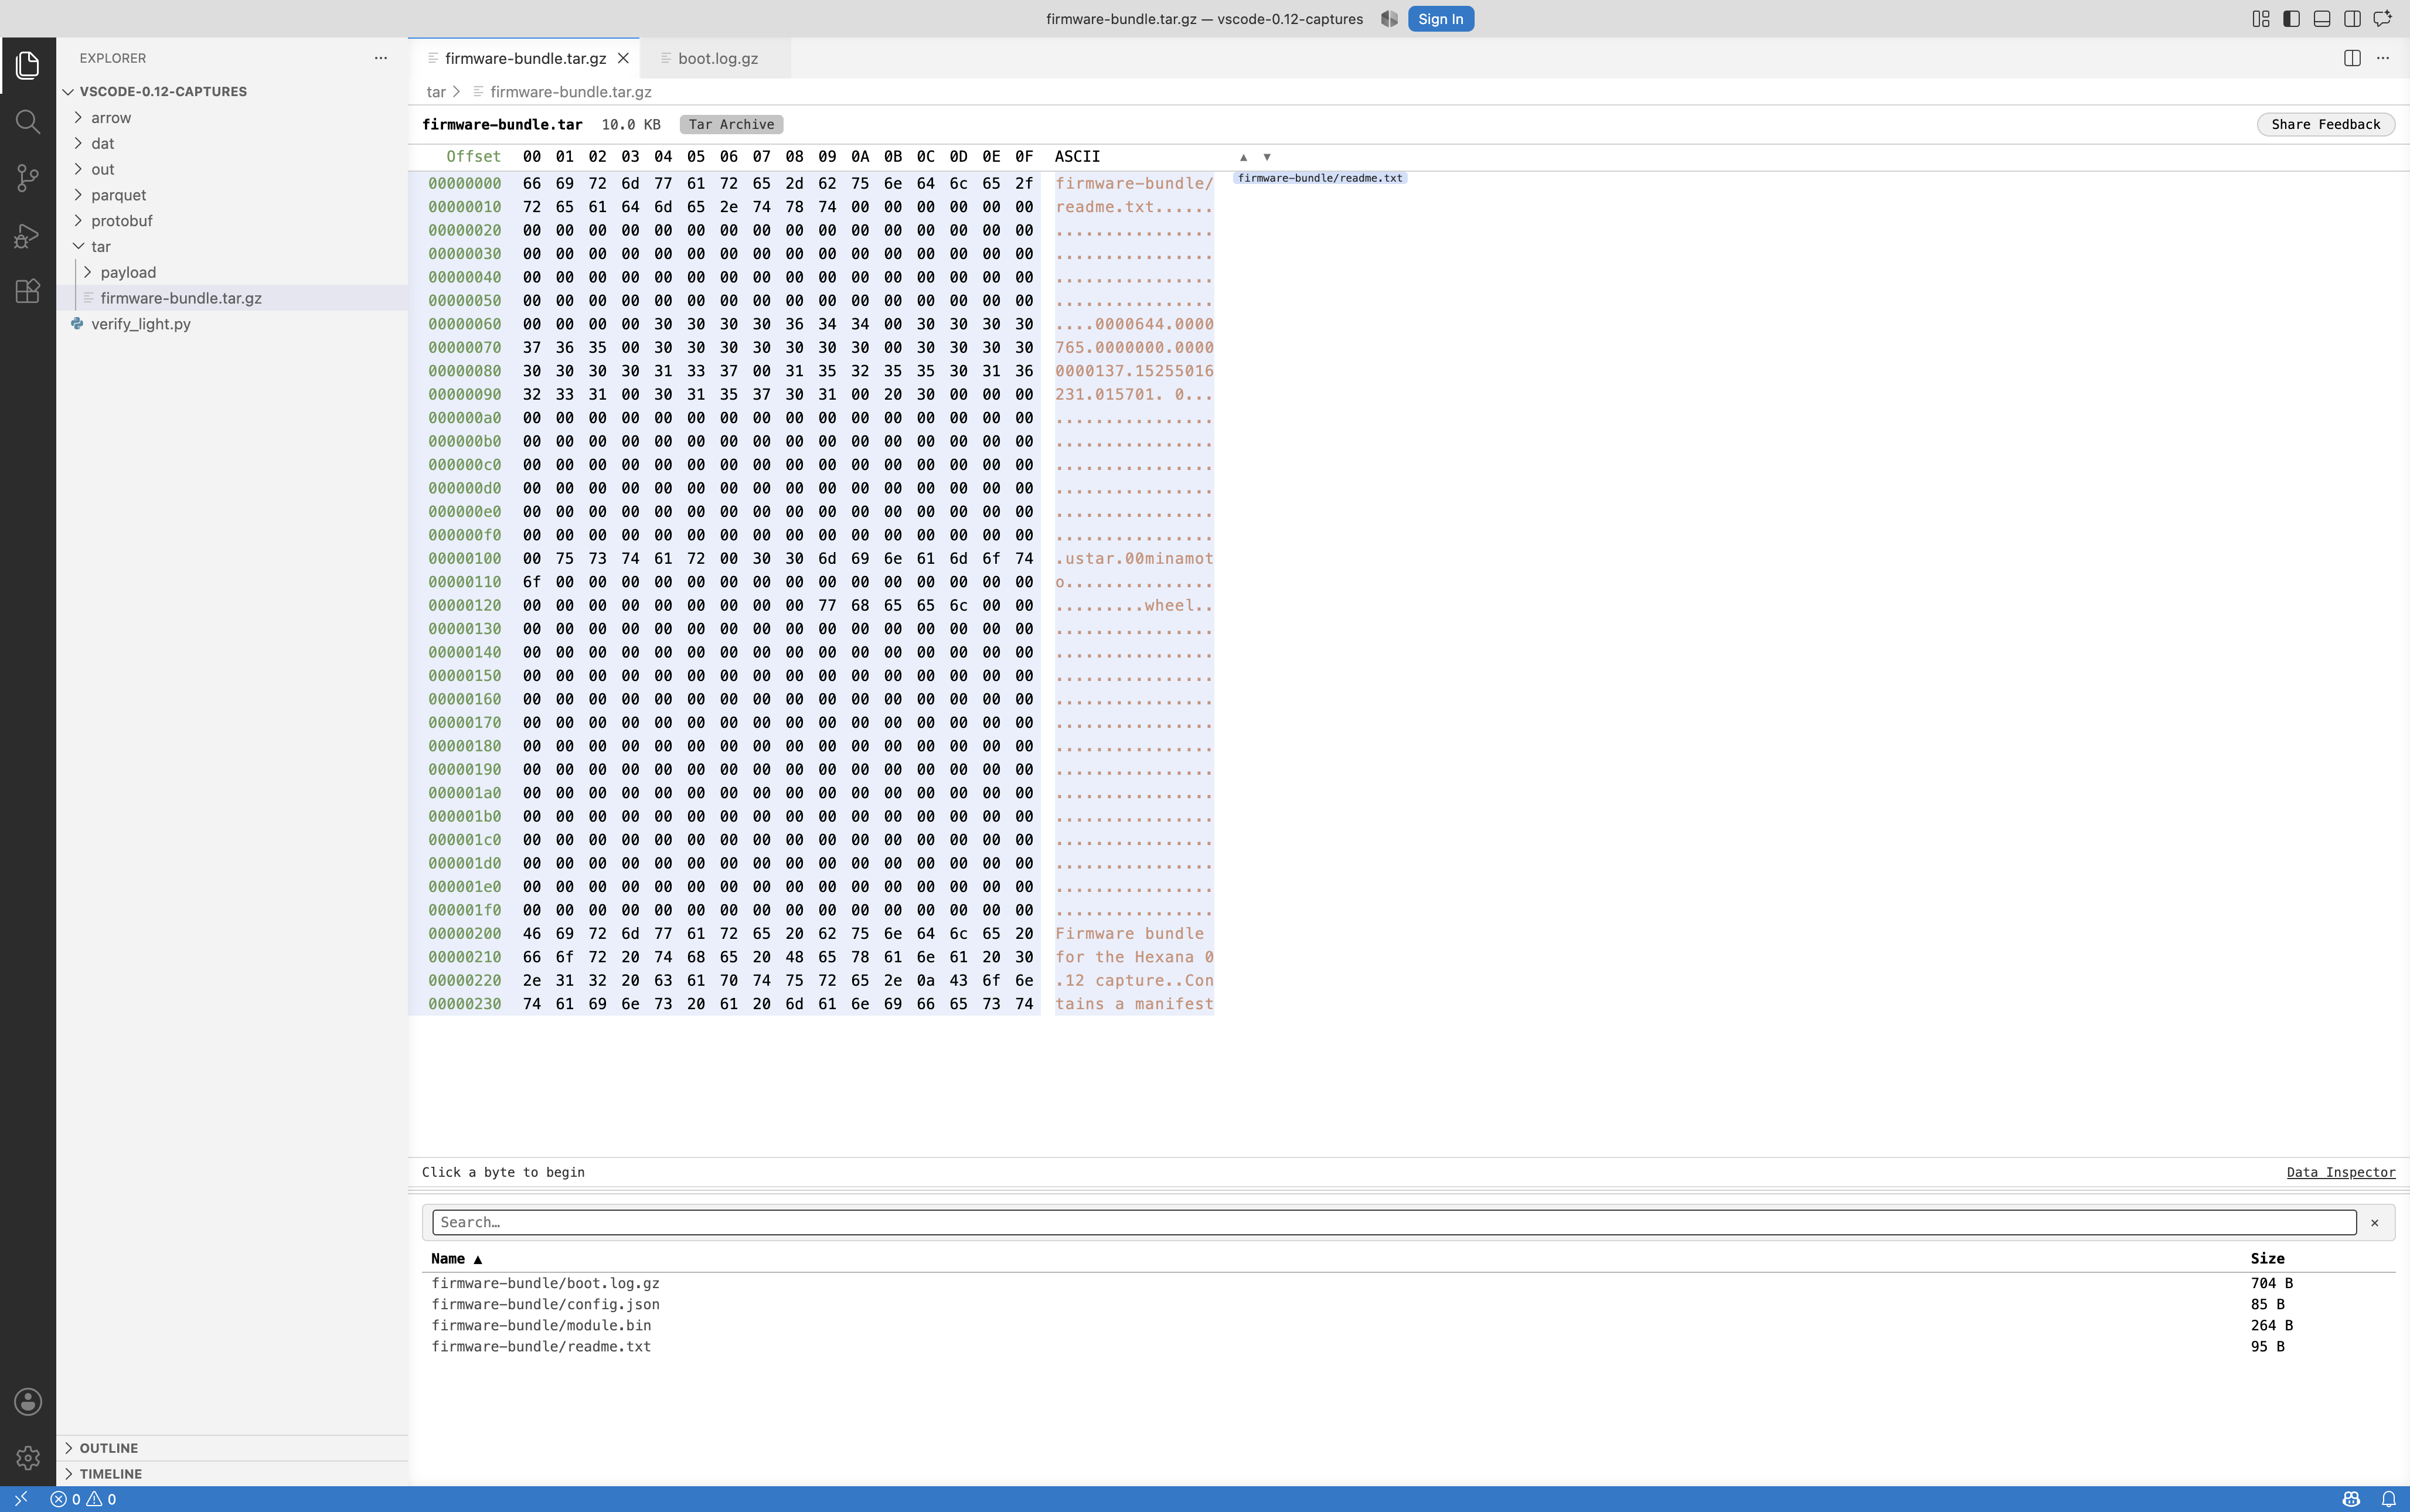
.tar archives and gzipped archives (.tar.gz, .tgz) list their entries, which can be opened in their own tab. Entries that are themselves gzipped are supported.
Reopen Editor With (0.12.0+)
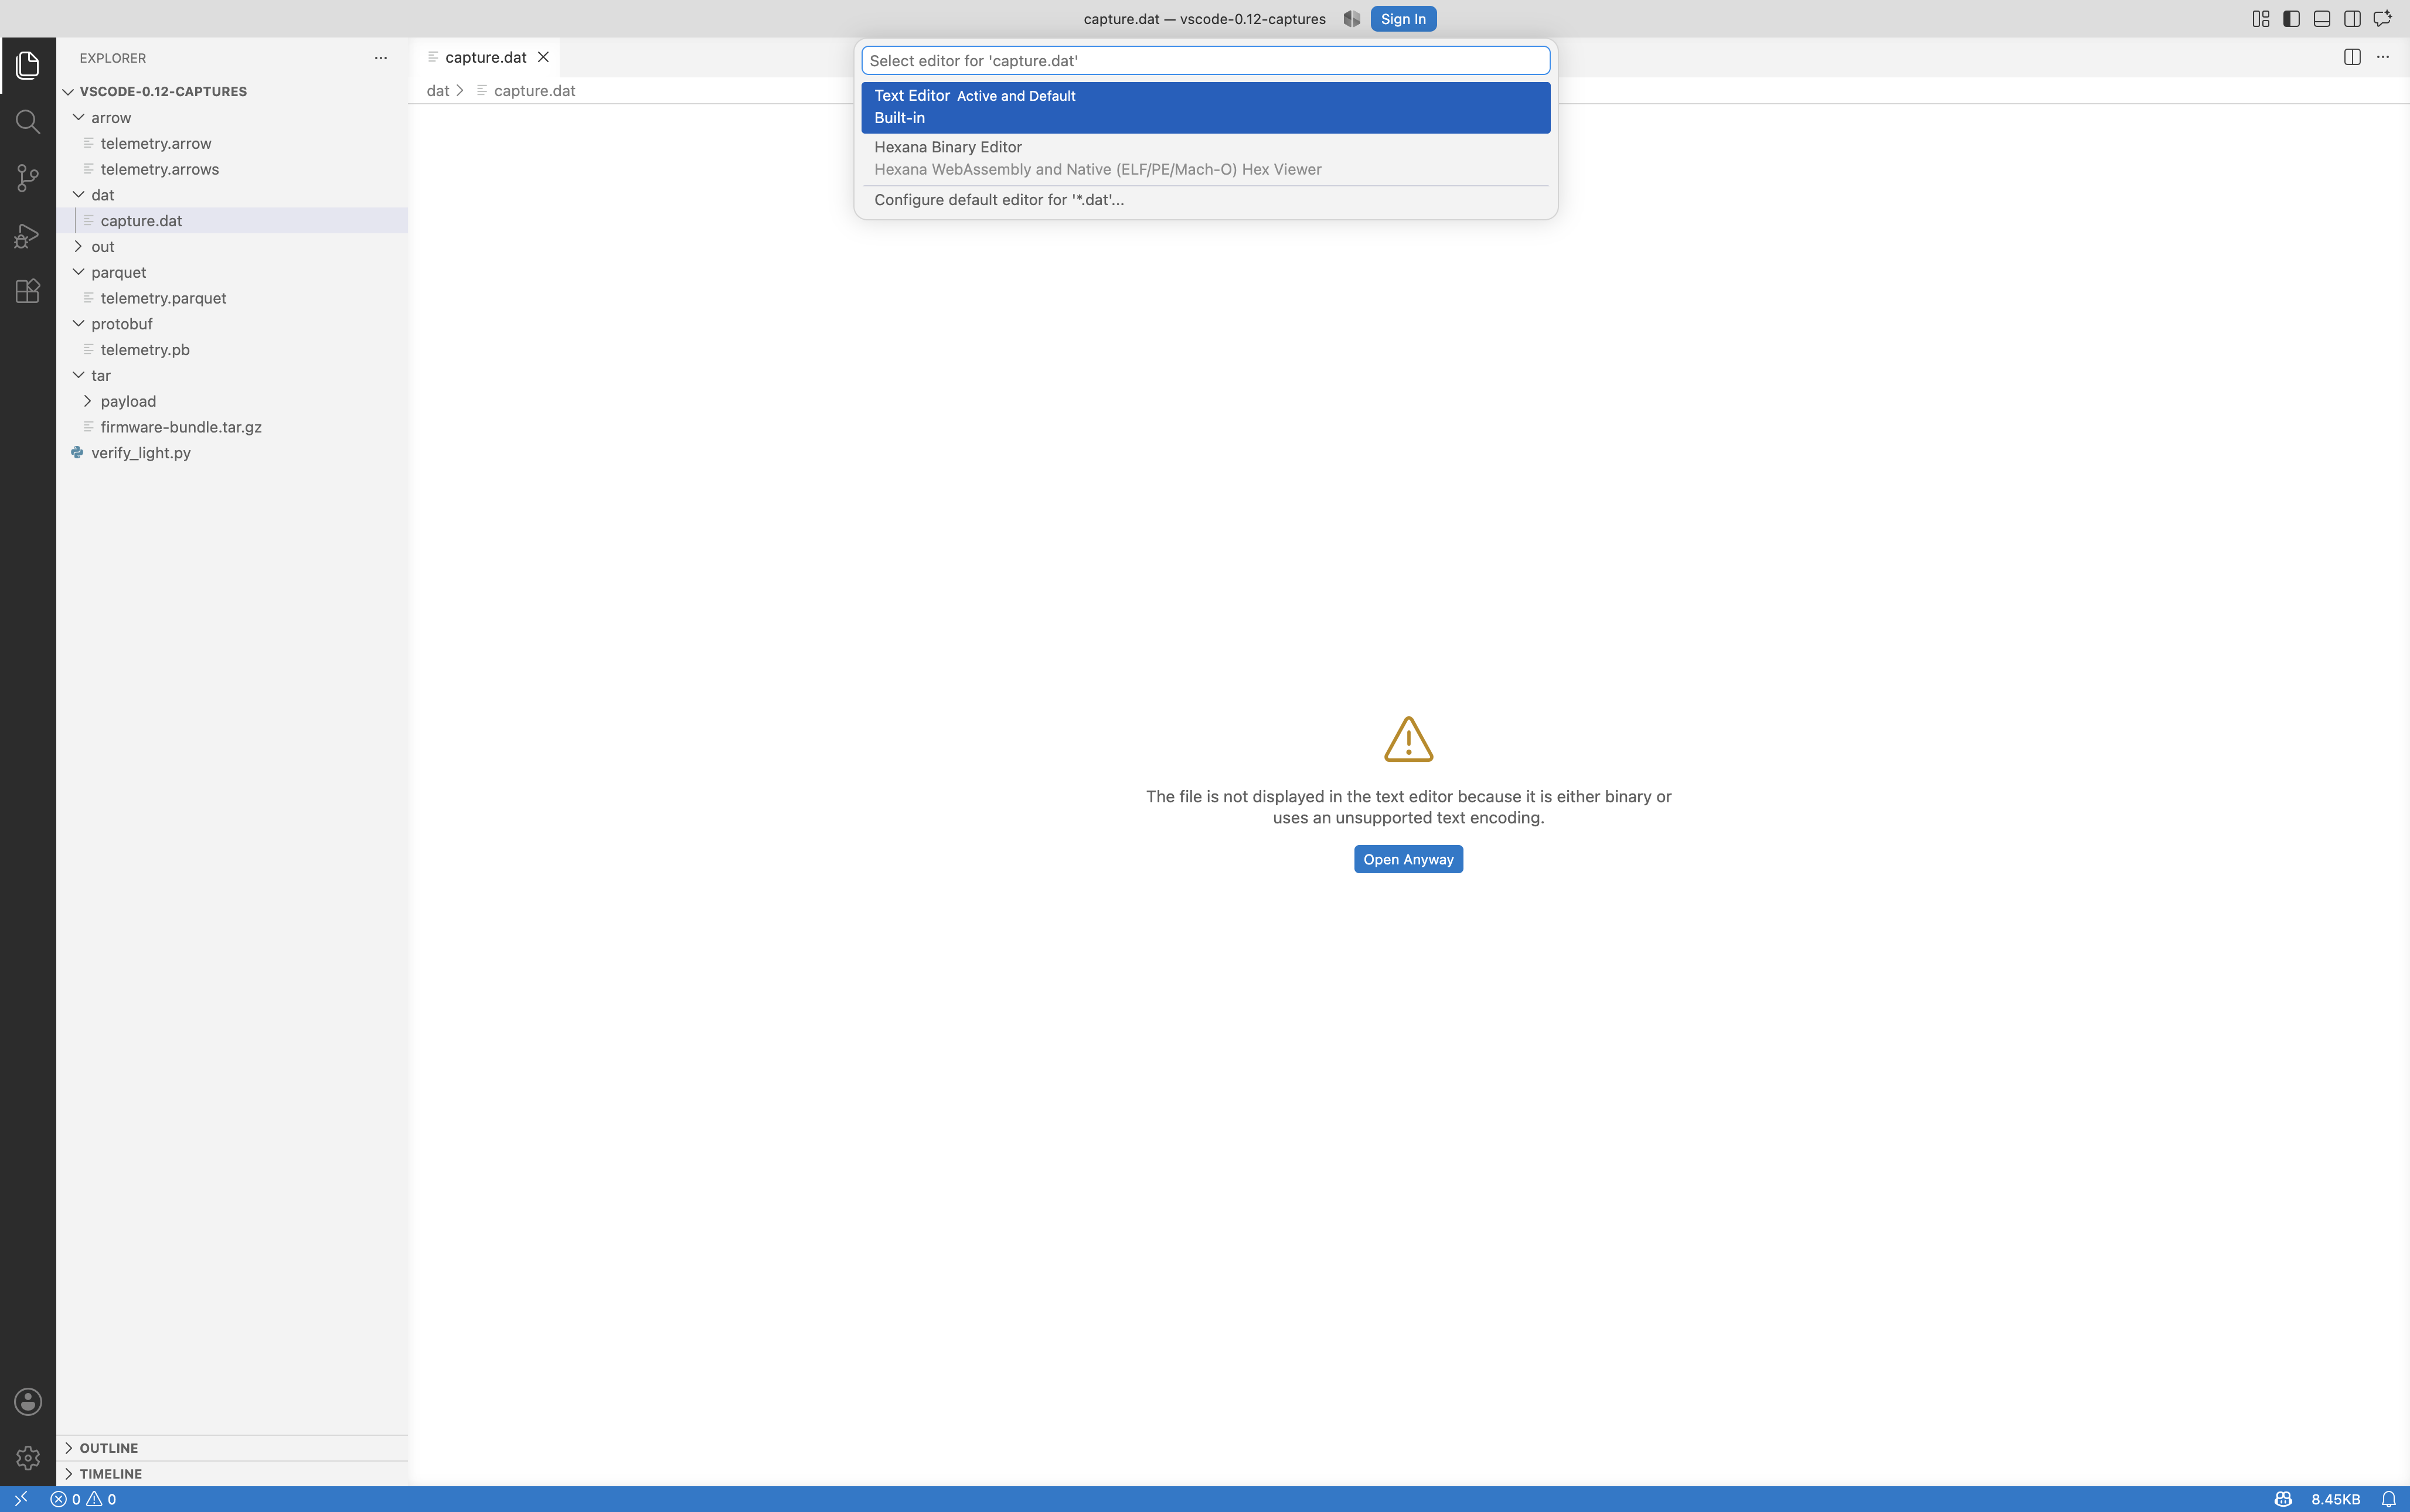
"Hexana Binary Editor" is offered for any file under Reopen Editor With, so a binary with an extension Hexana does not claim (an Arrow stream saved as .stream, a firmware image as .dat) can be opened in it on request. Files Hexana claims by extension continue to open automatically.
PCAP and PCAPng (0.10.0+)
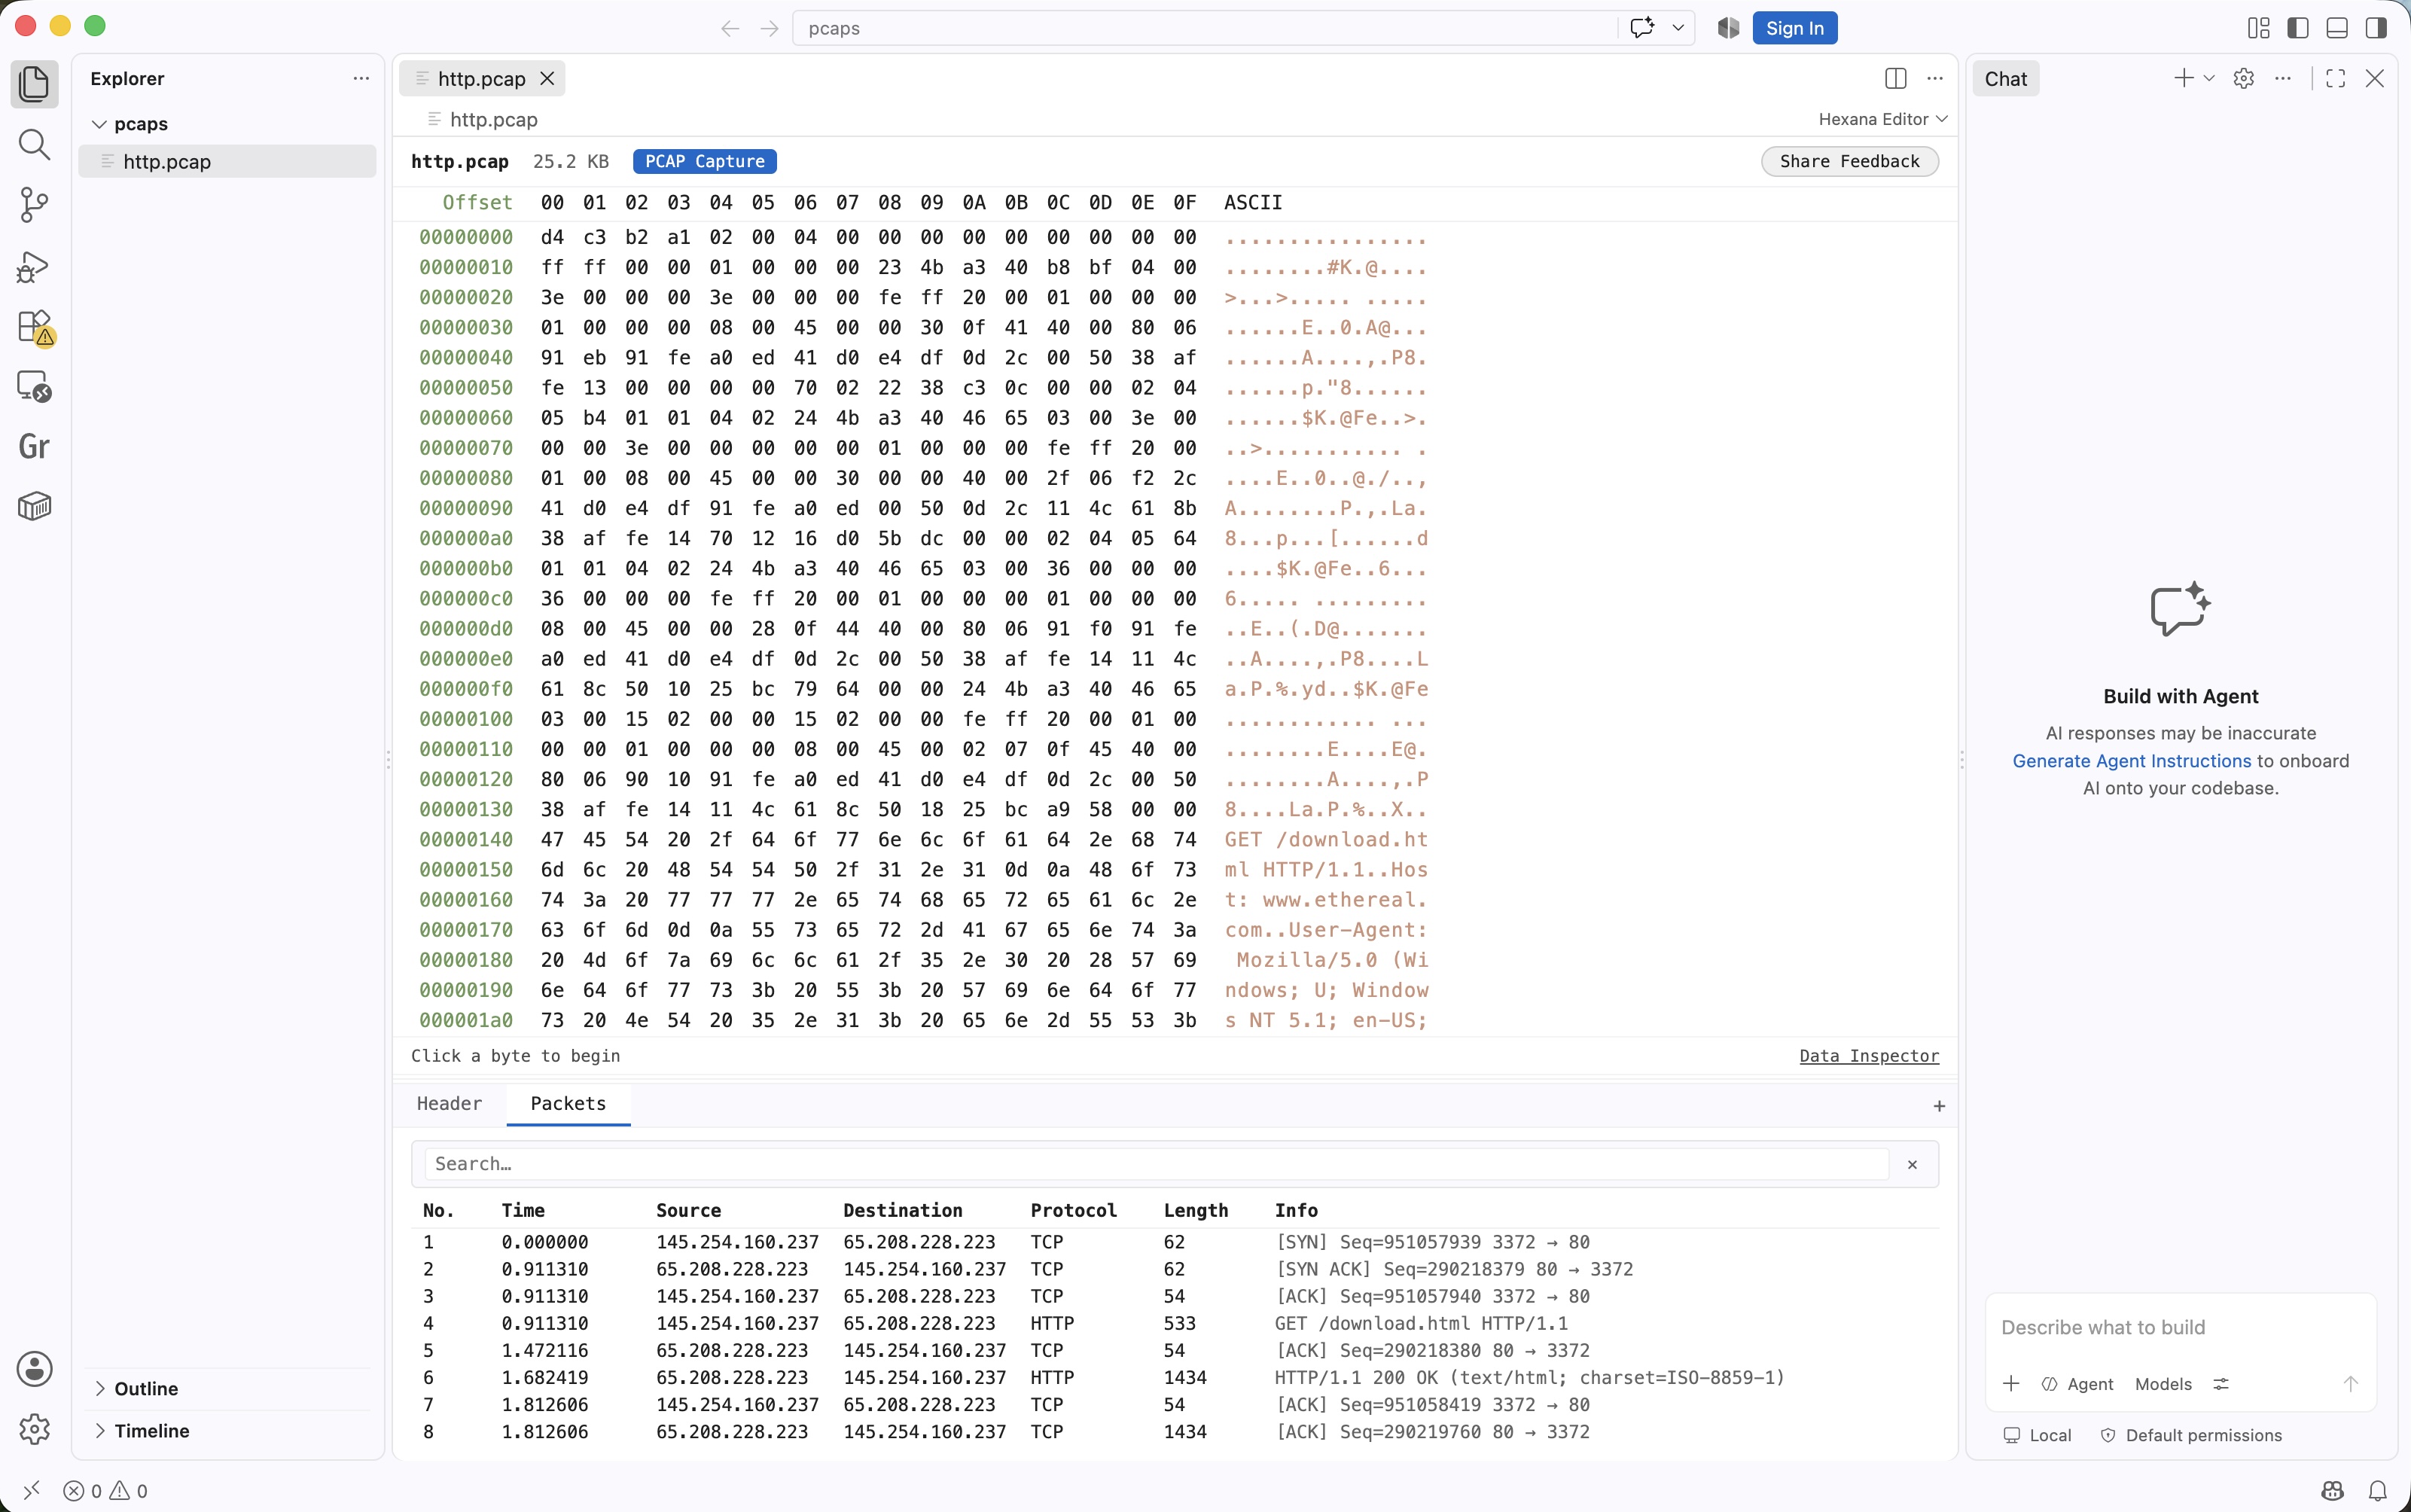
Network capture files open with a Header tab and a Packets tab listing packets with their timestamps, source, destination, protocol, and length. HTTP response bodies can be opened in a new tab.
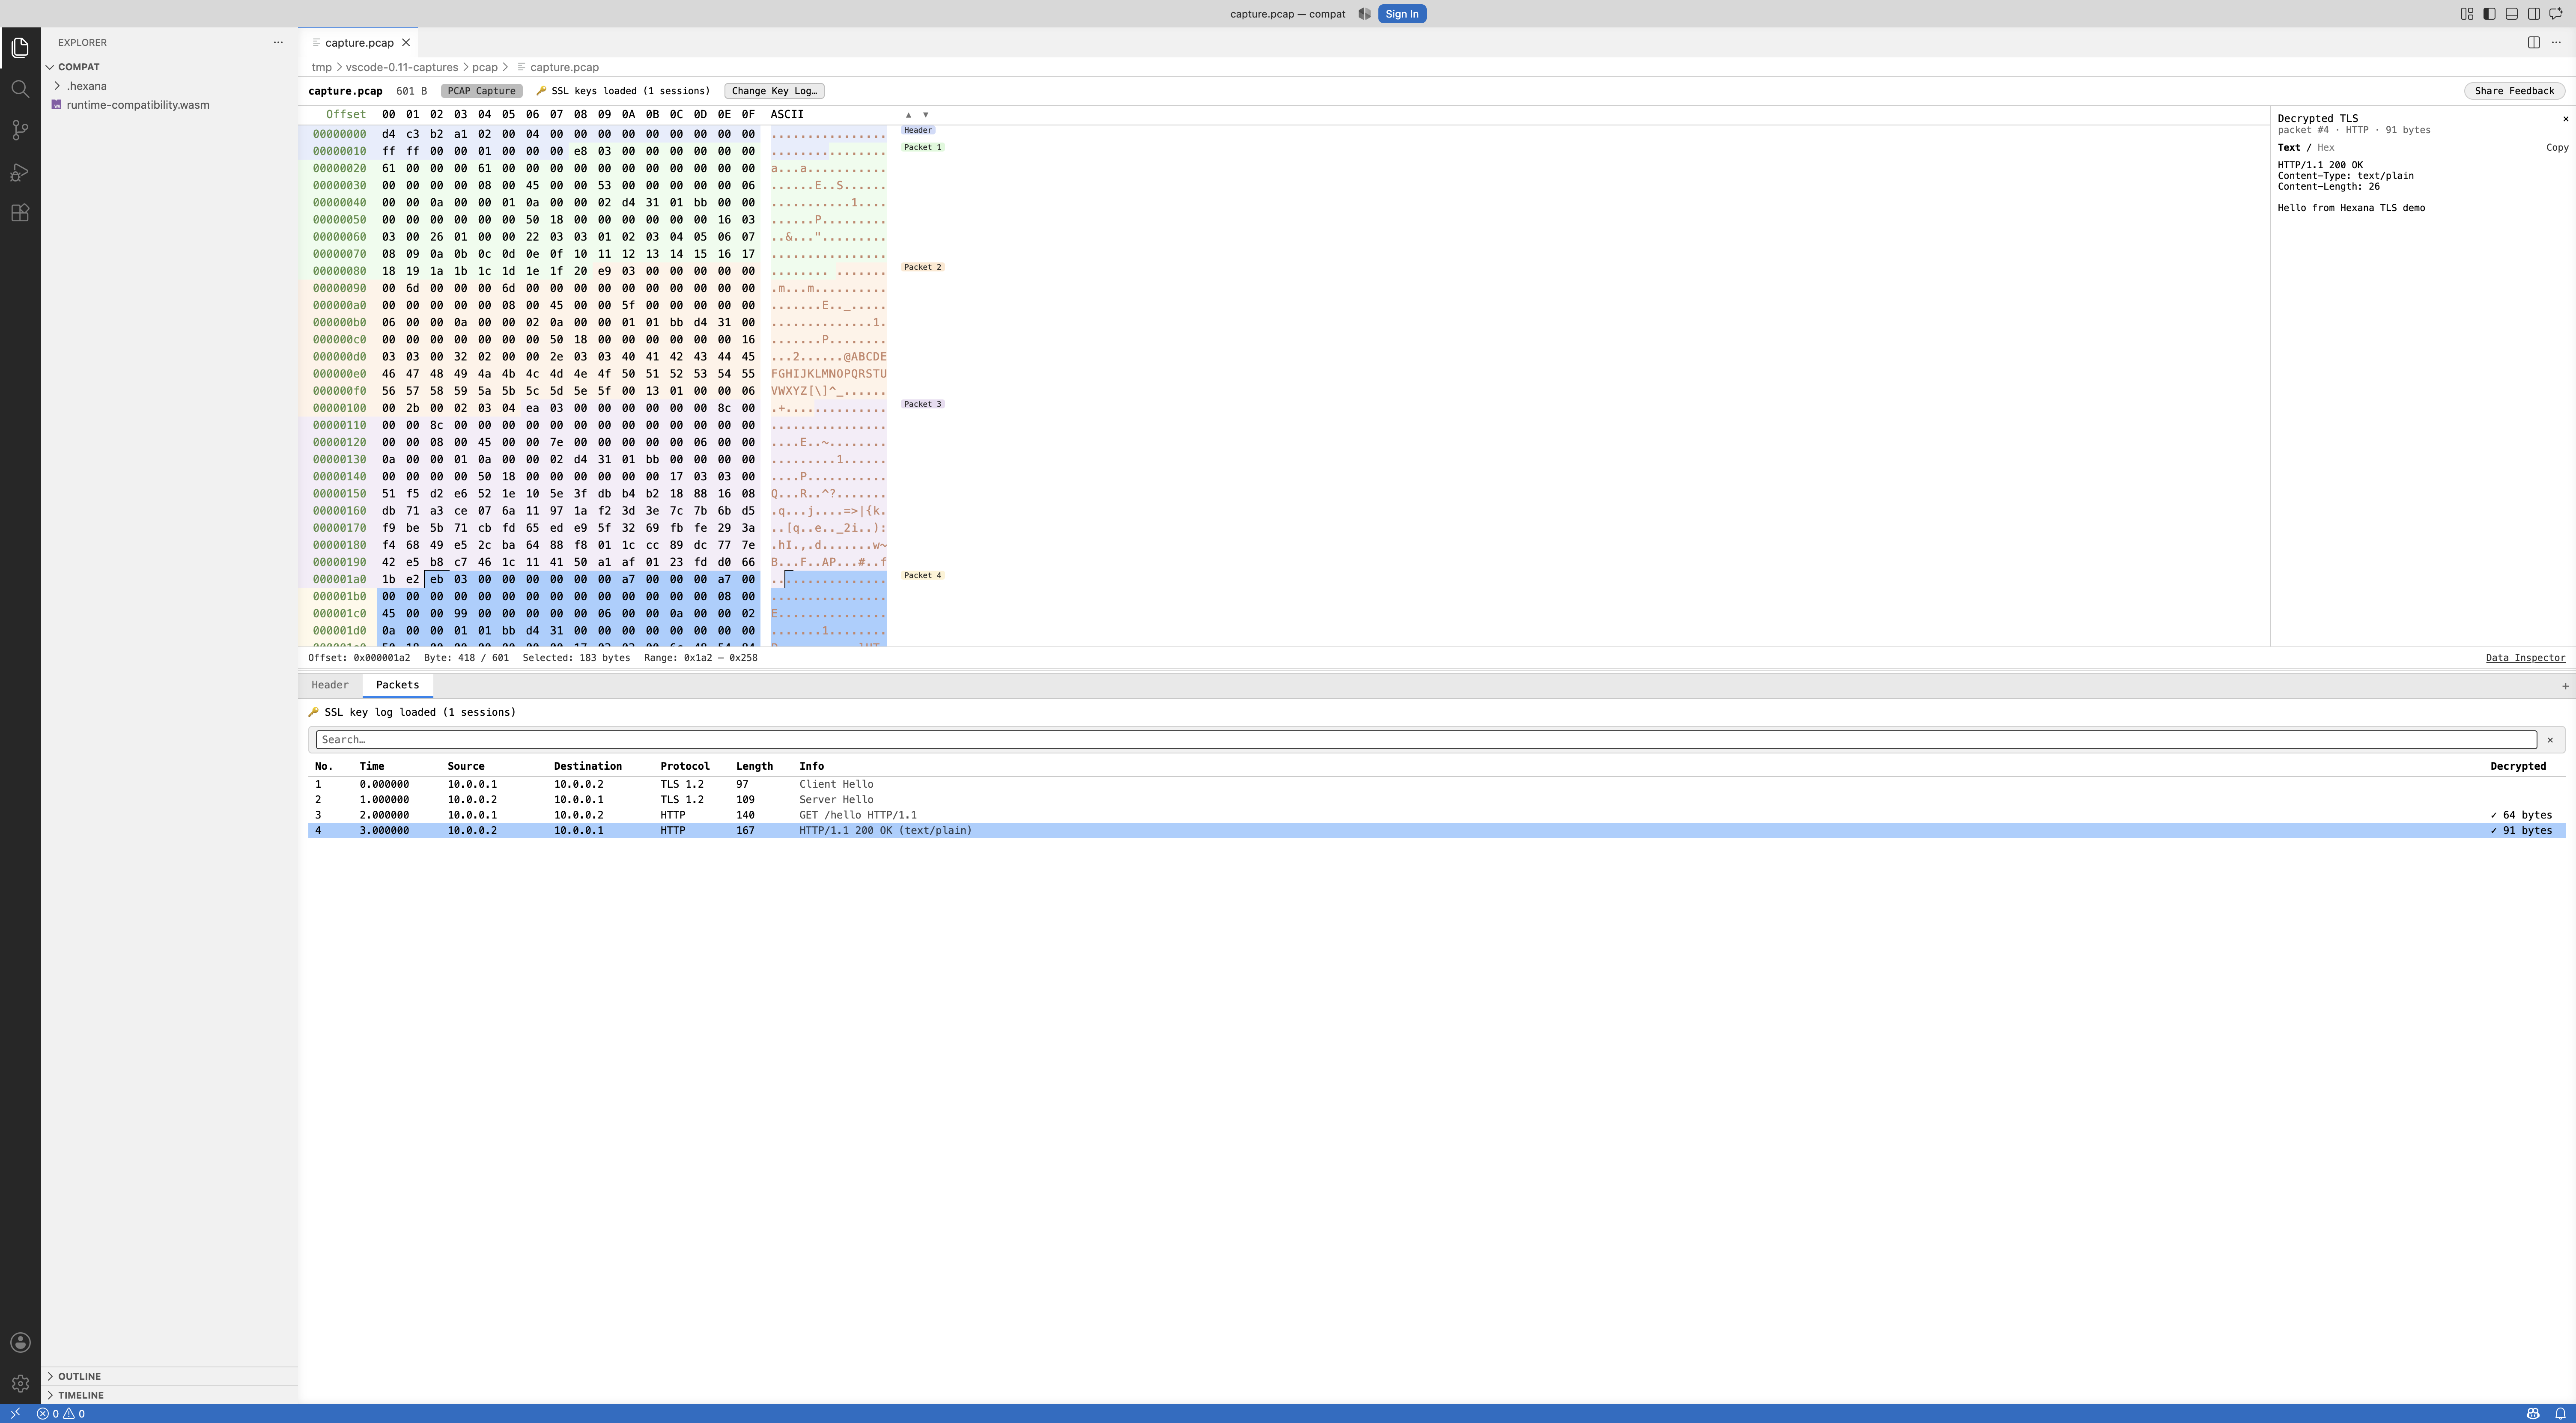
Since 0.11.0, PCAP TLS traffic can be decrypted using a user-provided SSL key log file.
Binary diff (0.7.0+)
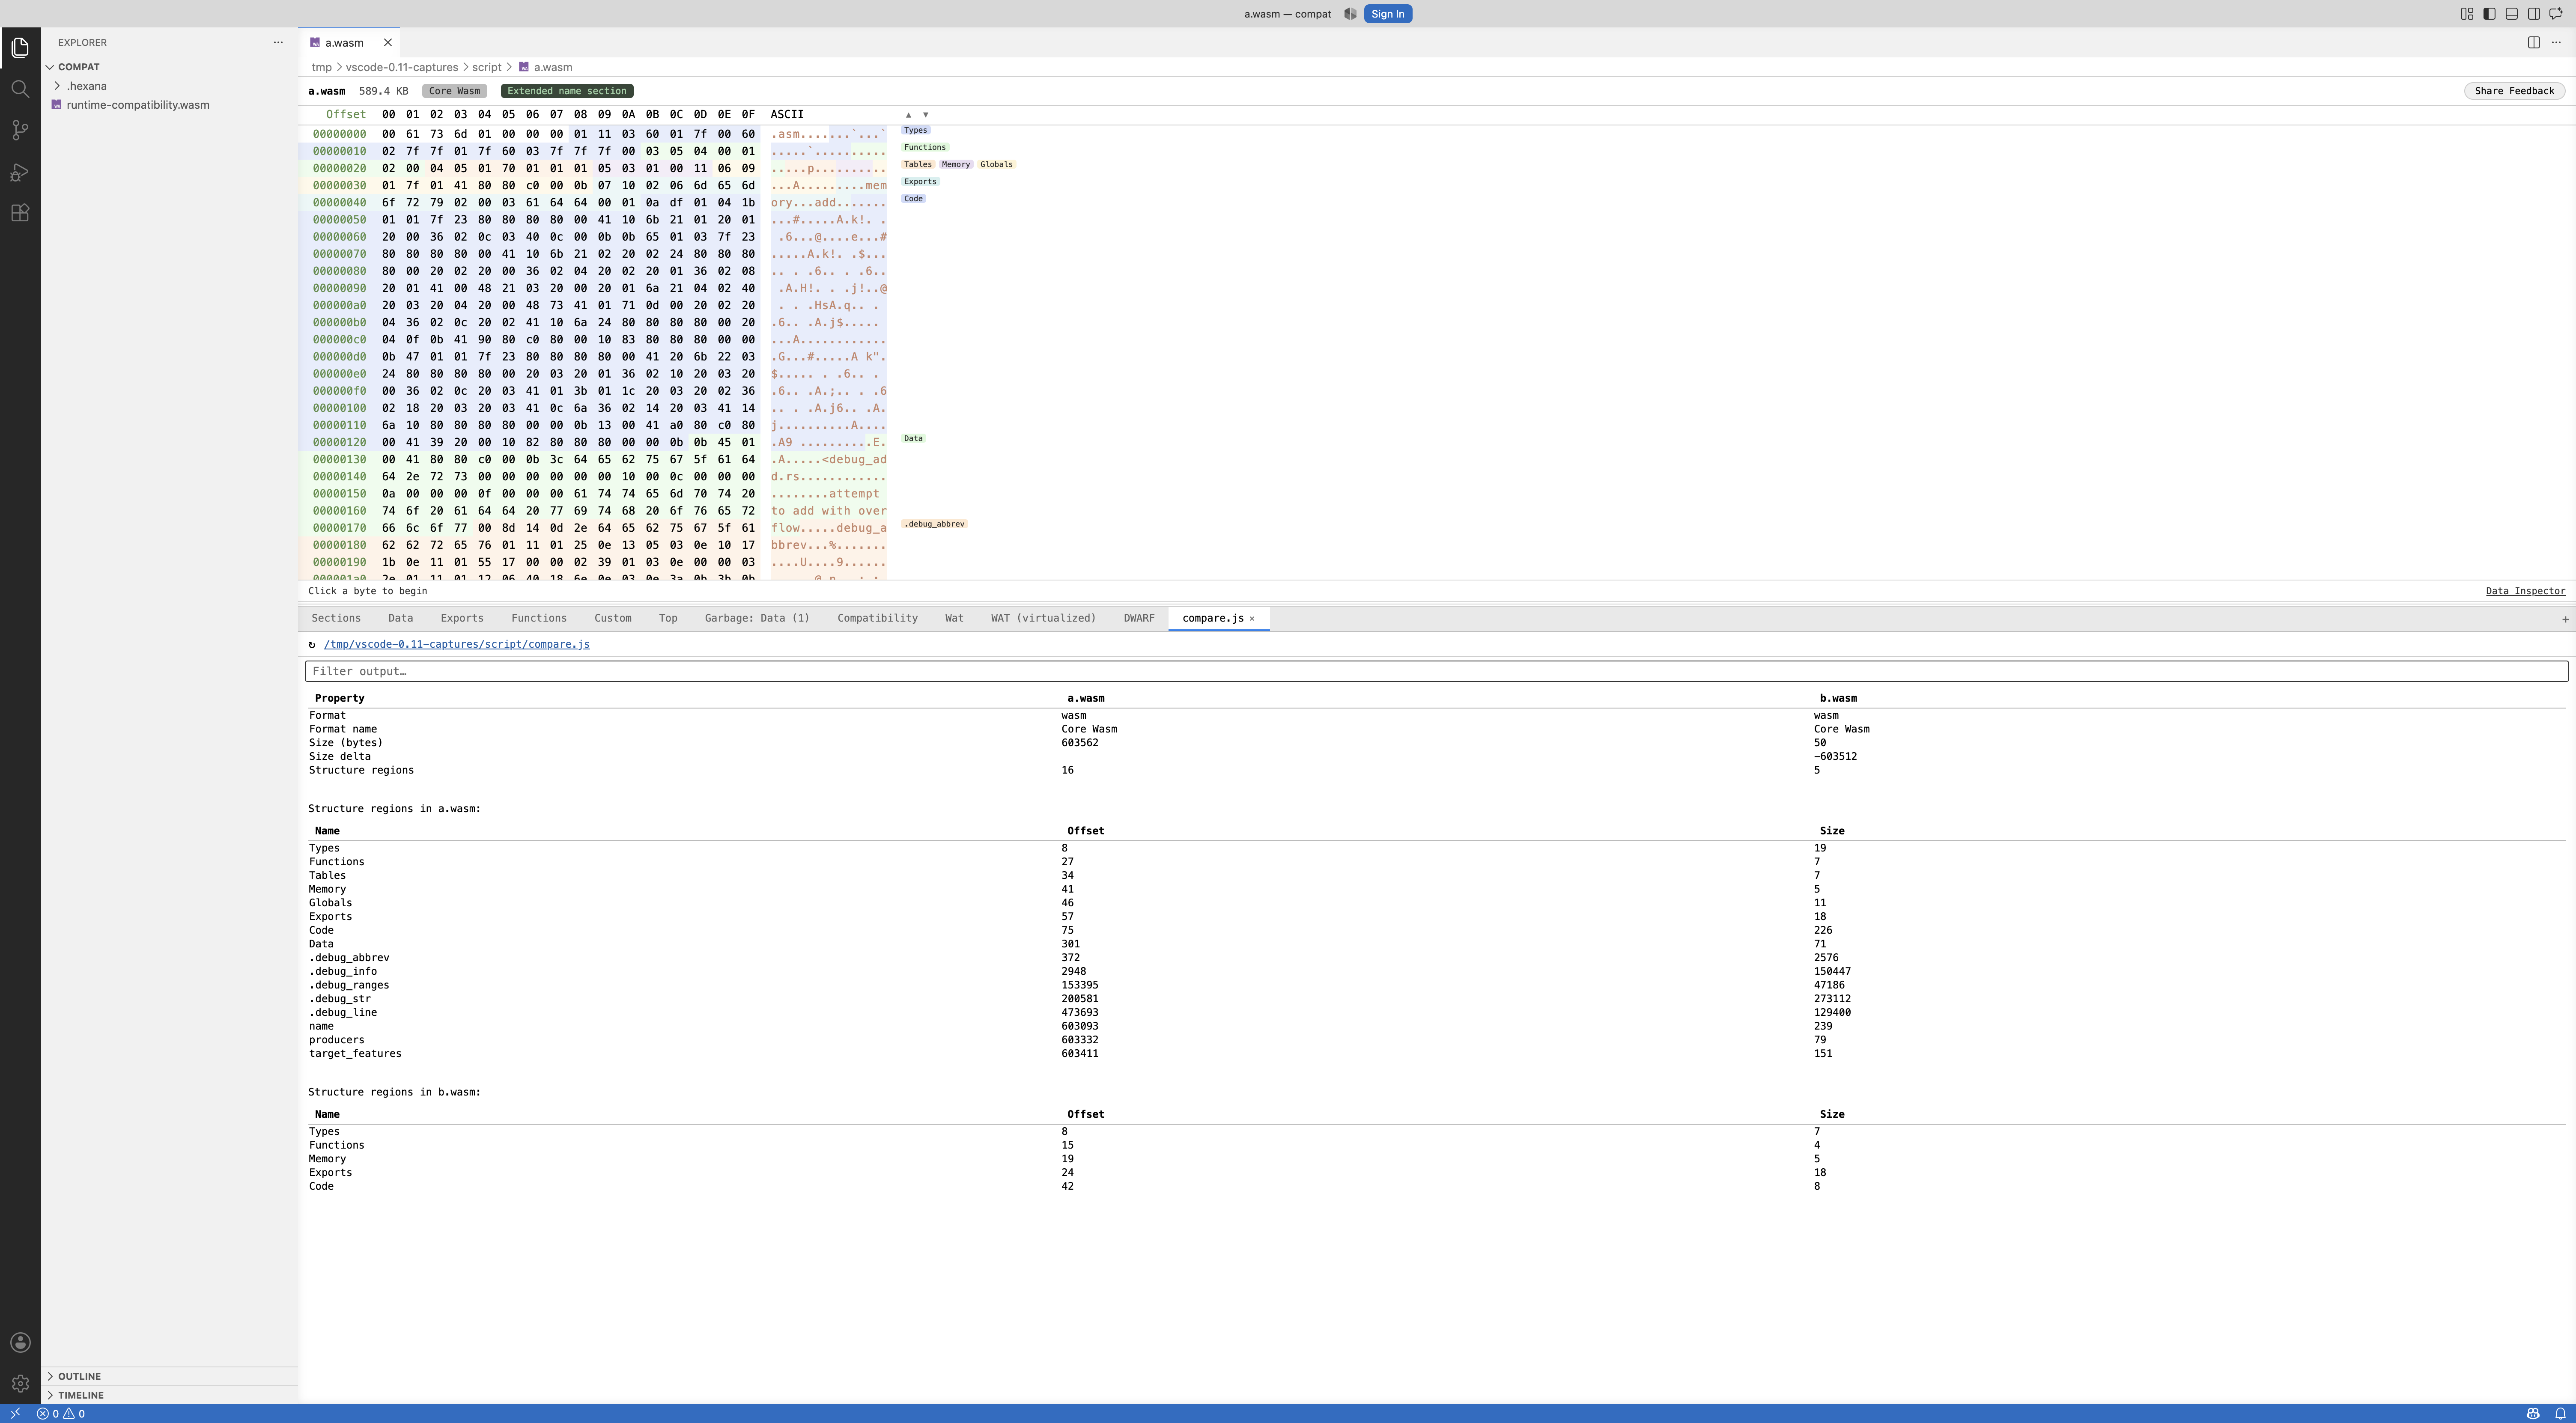
Hexana can compare two binary files. A unified "Hexana: Compare Files" command (0.13.0) selects the comparison mode from the files' contents, replacing the separate "Compare WASM" and "Compare Binary" commands. Existing keybindings keep working.
- WASM diff: compares two
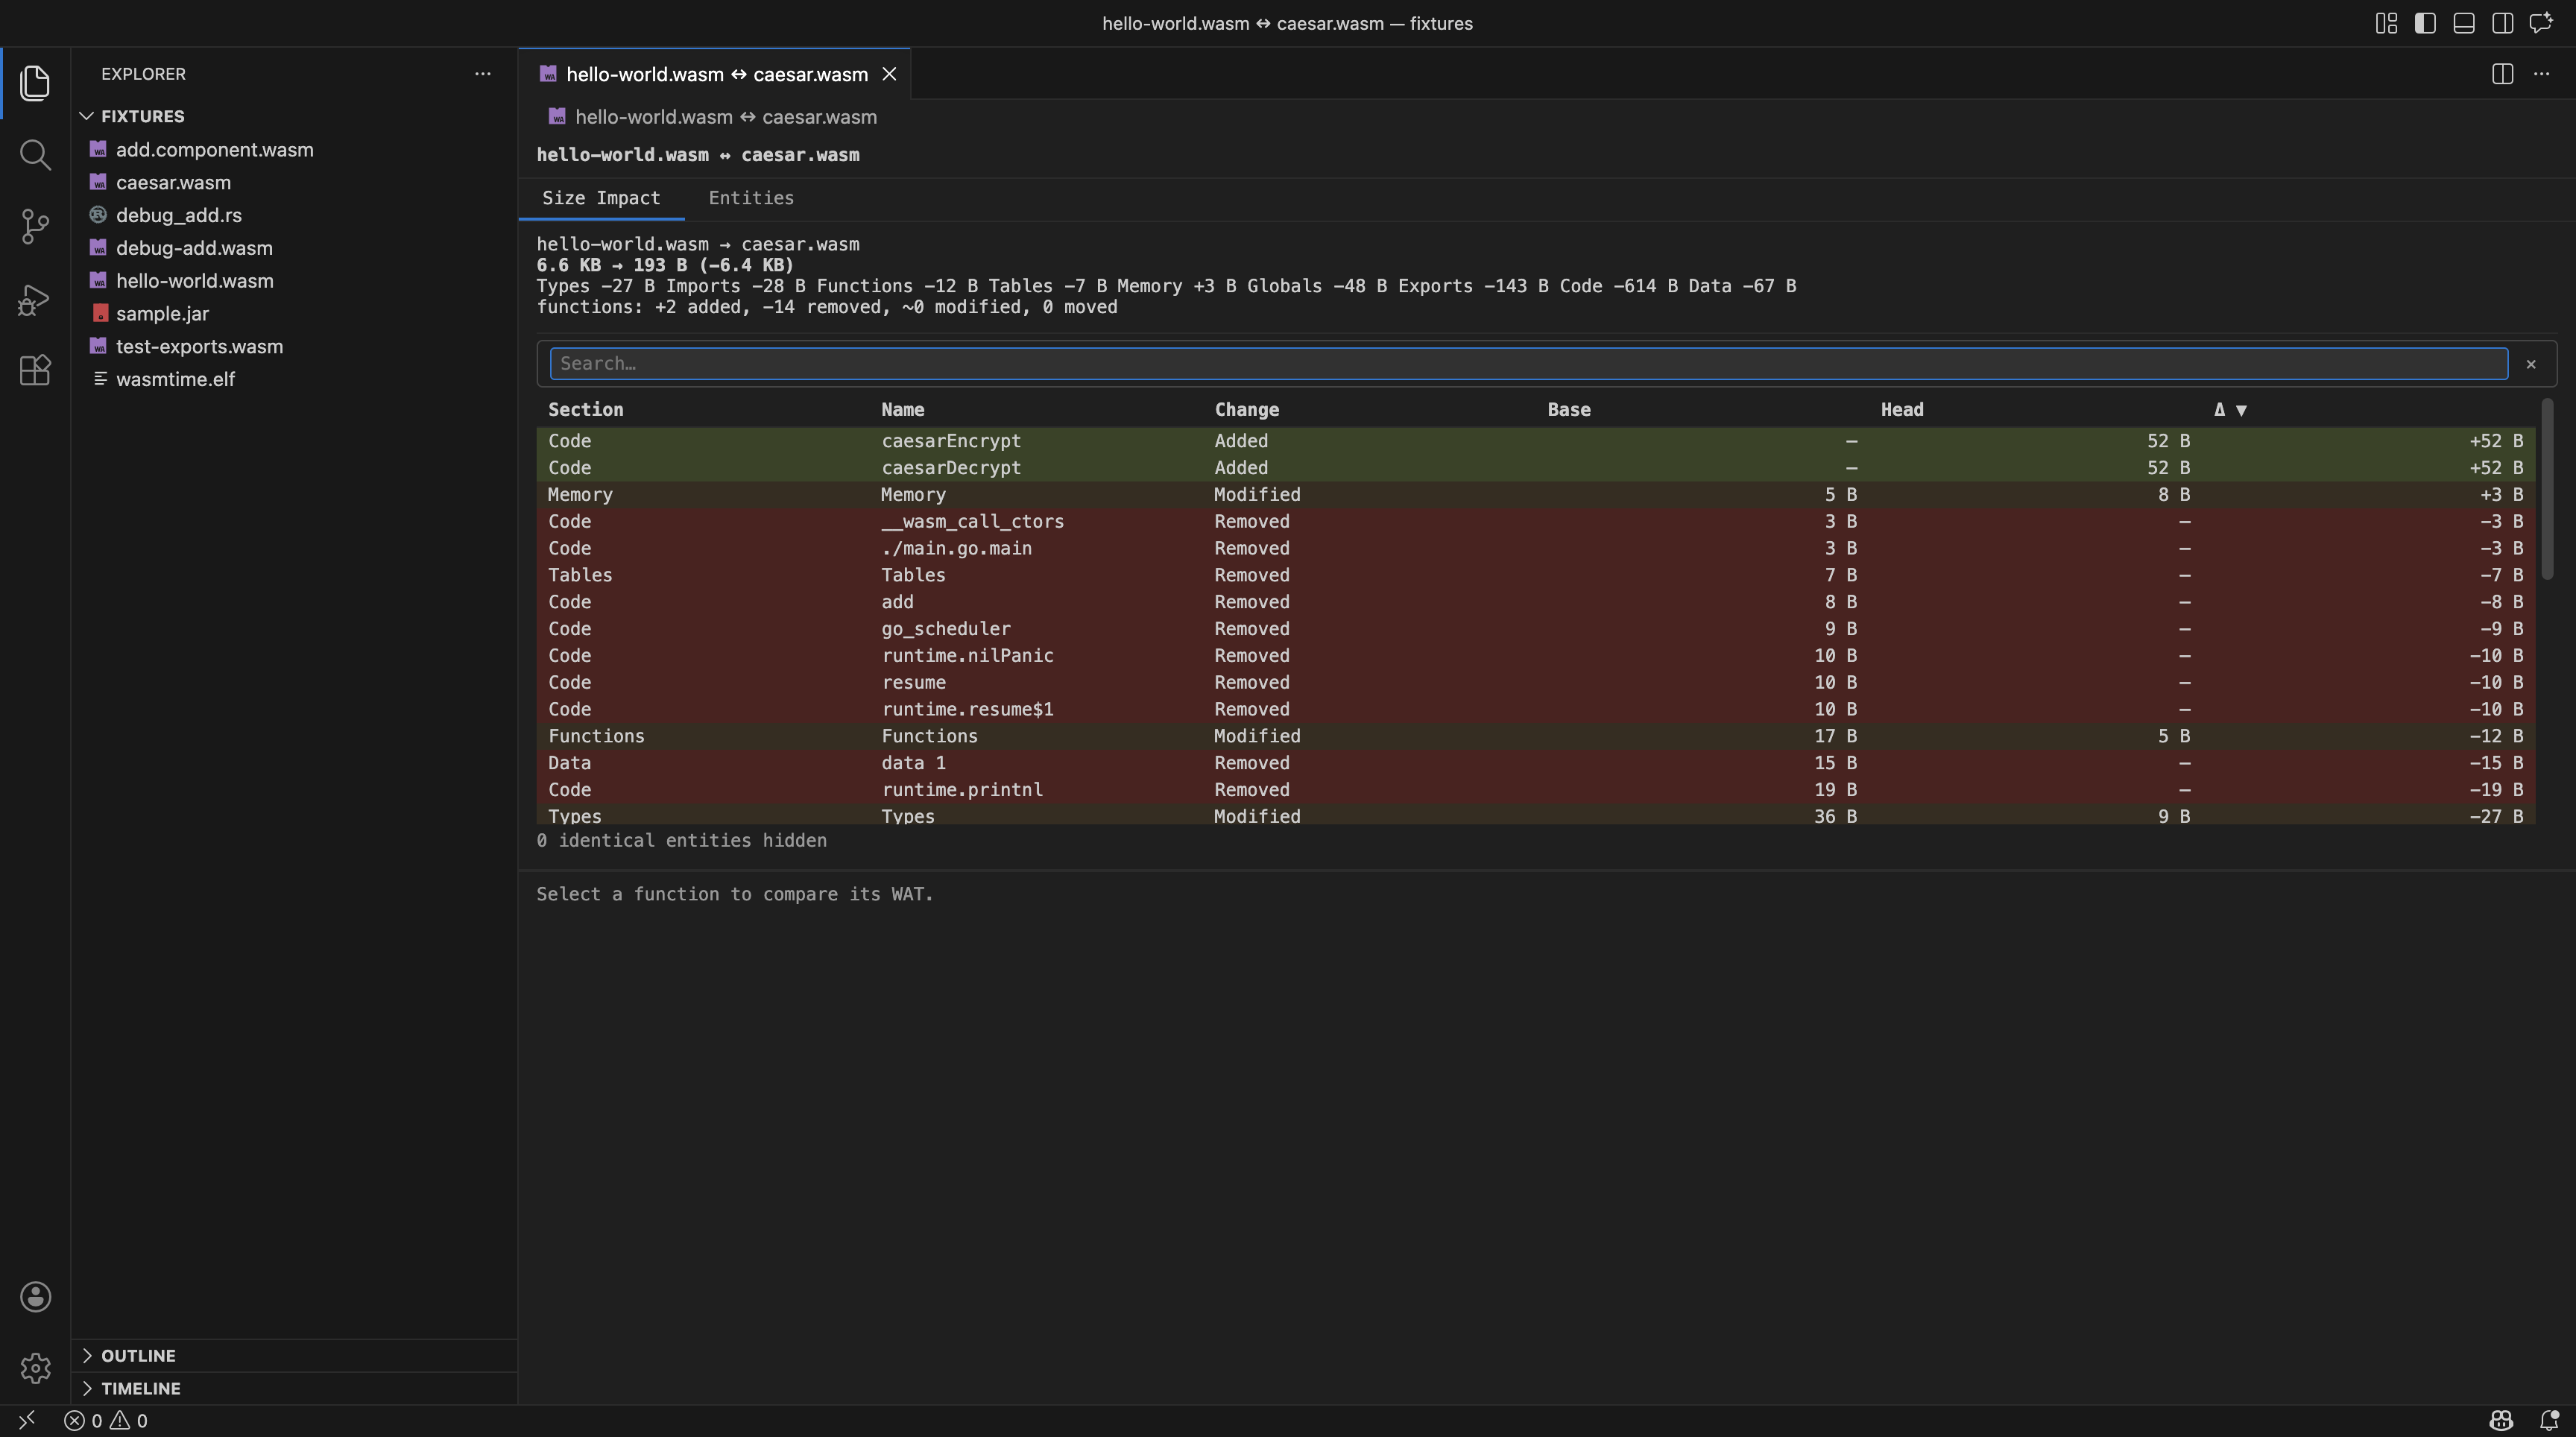
.wasmfiles. The Size Impact view shows the overall size delta and a per-entity breakdown (functions, data segments, imports, exports, tables, globals, memories) with columns for the base size, head size, and the delta. Select any function row to see a WAT body diff for that pair of functions in the lower pane. Since 0.13.0, a "Dispatch" tab shows per-signaturecall_indirectcandidates that entered or left the table, and Component Model comparison pairs submodules with a "Back" link. - Native binary diff: compares two ELF, Mach-O, or PE binaries, reporting size changes per section. Since 0.13.0, comparing two ELF, Mach-O, or COFF files also adds a Functions tab: functions are paired by name (renames recognized by identical code), and selecting one shows the two versions' bytes side by side.
- Hex diff (0.13.0): a second panel in the diff view shows both binaries side by side in hex. Changed bytes are highlighted (amber modified, red removed, green added); long unchanged stretches collapse into expandable "N unchanged rows" lines. Previous / next difference buttons and section bars mark which sections changed. The hex diff works for any pair of supported binaries.
VS Code's built-in "Compare Selected" on two binaries Hexana opens now shows Hexana's diff, opening on the hex diff panel (0.13.0). All comparison tables are searchable and sortable, and every tab loads in the background.
Data inspector (0.7.0+)
Selecting a byte in the hex viewer populates a data inspector panel showing different representations of the selected byte. The panel updates as you move the selection.
Section highlighting and navigation (0.8.0+)
Sections in WASM and native binary files are semantically highlighted by kind — code, data, imports, custom, and so on — so you can spot the structure at a glance, and you can jump between sections directly from the editor.
Save as (0.8.0+)
Nested WASM modules (embedded inside Component Model binaries) and individual entries inside JAR / ZIP archives can be saved to a separate file on disk with the Save as action. This is useful for extracting a core module from a component for standalone analysis, or for unpacking a specific file from a large archive.
Analysis tabs
Up to 14 built-in tabs inside the same editor, surfaced by binary kind, plus any number of scriptable tabs you add yourself (see below). All tables are sortable and searchable through the same built-in table control (unified in 0.6.0, with faster rendering). See analysis-tabs.md for the per-tab reference.
| Tab | Core Wasm | Component | Generic |
|---|---|---|---|
| Summary | ✓ | ✓ | ✓ |
| Exports | ✓ | ✓ | — |
| Imports | ✓ | ✓ | — |
| Functions | ✓ | — | — |
| Data | ✓ | — | — |
| Custom | ✓ | — | — |
| Top | ✓ | ✓ | ✓ (0.9.0) |
| Monos | ✓ | — | — |
| Garbage | ✓ | — | — |
| Modules | — | ✓ | — |
| WAT | ✓ | ✓ | — |
| Dependencies | — | ✓ | — |
| DWARF | ✓ | n/a | n/a |
| Compatibility | ✓ | n/a | n/a |
| Problems | ✓ | ✓ | n/a |
The WAT tab uses virtual scrolling since 0.5.0 — only the visible portion of the text is rendered, which keeps navigation fast in large modules. For Component Model binaries, the WAT panel shows the embedded core modules with a selector when there are multiple (0.6.1). See analysis-tabs.md#wat for details.
The DWARF tab (0.11.0) groups .debug_abbrev, .debug_info, and .debug_line under a single searchable tab; clicking a row selects the corresponding bytes in the hex viewer.
The Compatibility tab (0.11.0) lists proposals the module uses that are not supported by any configured target runtime. Declare runtimes via "Hexana: Configure Target Runtimes" and unsupported proposals appear both here and in the editor header.
The Problems tab (0.10.0) lists regions the parser could not decode with location, offset, and message.
Scriptable info tabs (0.6.0+)
Click "+" in the analysis tab bar to add a custom script tab. A dialog opens with usage instructions and an API reference. Write a JavaScript script using:
print(text)— append a line to the tab's output. Output formatted as CSV or TSV is rendered as a table.table(...)/row(...): structured table output.binary: the current file's parsed binary provider:format,size,path,dir,structure,strings,sizeAnalysis,binary.tabs/binary.tab(name).open(path): parse another file into the same members asbinary, so a script can compare two files. Callopenat the top level of the script rather than inside a function.
It is a lightweight way to add your own analysis layer: ad hoc queries, custom field decoders, cross-file comparisons.
Feedback button (0.6.0+)
A dedicated feedback / report-issue button makes it easier to share feedback or file a bug without leaving the editor.
Run support
A Run button and a separate Debug button in the editor toolbar, present when at least one runtime is discoverable.
- Runtime picker — Wasmtime, WAMR, GraalVM, wazero, Node.js, or the browser (Node.js and browser added in 0.3.0, debuggable since 0.4.0; wazero added in 0.6.0, module execution only). Unavailable runtimes are greyed out with a tooltip explaining why.
- Core modules: pick an export, the runtime, and supply arguments. Hexana invokes the chosen runtime in a VS Code terminal with auto-generated import stubs and the runtime's equivalent of
--preloadfor data segments. - Component Model binaries: Hexana resolves imports by scanning workspace directories for matching
.wasmfiles (transitively), composes the result throughwasm-tools composeorwac plug, then invokes the chosen runtime on the composed component.
See run-support.md for the full reference.
Debugging (experimental)
A Debug button alongside Run launches the module under a debugger. Two backends, by runtime (GraalVM is run-only):
- gdbstub-backed (Wasmtime 44+, 0.10.0). The module runs under
wasmtime run -gand LLDB attaches through the wasm process plugin. DWARF is read directly from the binary. Older wasmtime falls back to the nativelldbpath with a visible warning. lldb-backed (Wasmtime older, WAMR). Requires LLVM 22.1 or newer; breakpoints map to source via DWARF.- CDP-backed — Node.js and Chrome (0.4.0). Hexana launches Node.js with
--inspect-brkor Chrome with--remote-debugging-port, connects over the Chrome DevTools Protocol, and translates DAP ↔ CDP.
Across backends:
- Set breakpoints in source files associated with the module (PC ↔ source mapping via DWARF).
- Step over, into, out; continue past hit breakpoints.
- Source-level stepping (0.10.0, nodejs/browser): a step repeats per-instruction wasm steps until the DWARF source line or stack depth changes.
- Inspect local variables for compilers that emit DWARF with usable location expressions (Rust, C/C++, Emscripten with
-g). - Linear-memory variable decoding (0.10.0, nodejs): structs, arrays, and enums stored in linear memory are located via DWARF and decoded per type in the Variables view.
- Inlined call frames (0.10.0): inlined frames in the stack trace are marked "(inlined)".
- Conditional breakpoints (0.10.0, nodejs): conditions evaluated by V8; wasm-level names work directly.
- Component Model nested-module breakpoints are supported on Wasmtime.
- "Wasm" debugger view (0.10.0): "Hexana: Open Wasm View" in the bottom panel shows WAT-style disassembly of the paused function with the current instruction highlighted, plus the operand stack (slot, type, value). Works for nodejs, browser, wasmtime gdbstub, and WAMR sessions.
- Disassembly View integration (0.10.0, nodejs/browser): "Open Disassembly View" while paused shows one WAT-style instruction per row with module-absolute byte offsets and interleaved DWARF source locations.
See run-support.md for the full reference and known limitations.
MCP server (downloaded on demand)
Hexana integrates with VS Code's Model Context Protocol server registration API: AI tooling (Claude Code, Codex, Cursor's agent mode, Continue) can connect to the Hexana MCP server to inspect Wasm and native binaries (ELF, Mach-O, PE) currently open in VS Code.
- First-run download. On first MCP use, Hexana downloads the standalone MCP server and extracts it to
globalStorage. Since 0.6.0, supported platforms fetch platform-native artifacts from the JetBrains downloads index by default; other platforms use GitHub Releases. If the downloads metadata is unavailable, a clear error is shown — the extension no longer silently switches to GitHub. Subsequent launches reuse the cached install; stale download locks are detected and recovered automatically. Hexana: Reinstall MCP Servercommand (Command Palette) — re-runs the download to recover from a corrupted install or to re-pull after a Hexana update.- Java requirement. On macOS arm64 and Linux x64, the MCP server uses a bundled native executable — no JDK needed. On other platforms (e.g. Windows), the server falls back to a JVM package; Java 21+ is required there. Hexana looks at
JAVA_HOME,PATH, and thehexana.mcp.javaHomesetting; if no suitable JDK is found on a JVM-fallback platform, MCP fails to start with an actionable error and Run / Debug are unaffected.
Component Model support
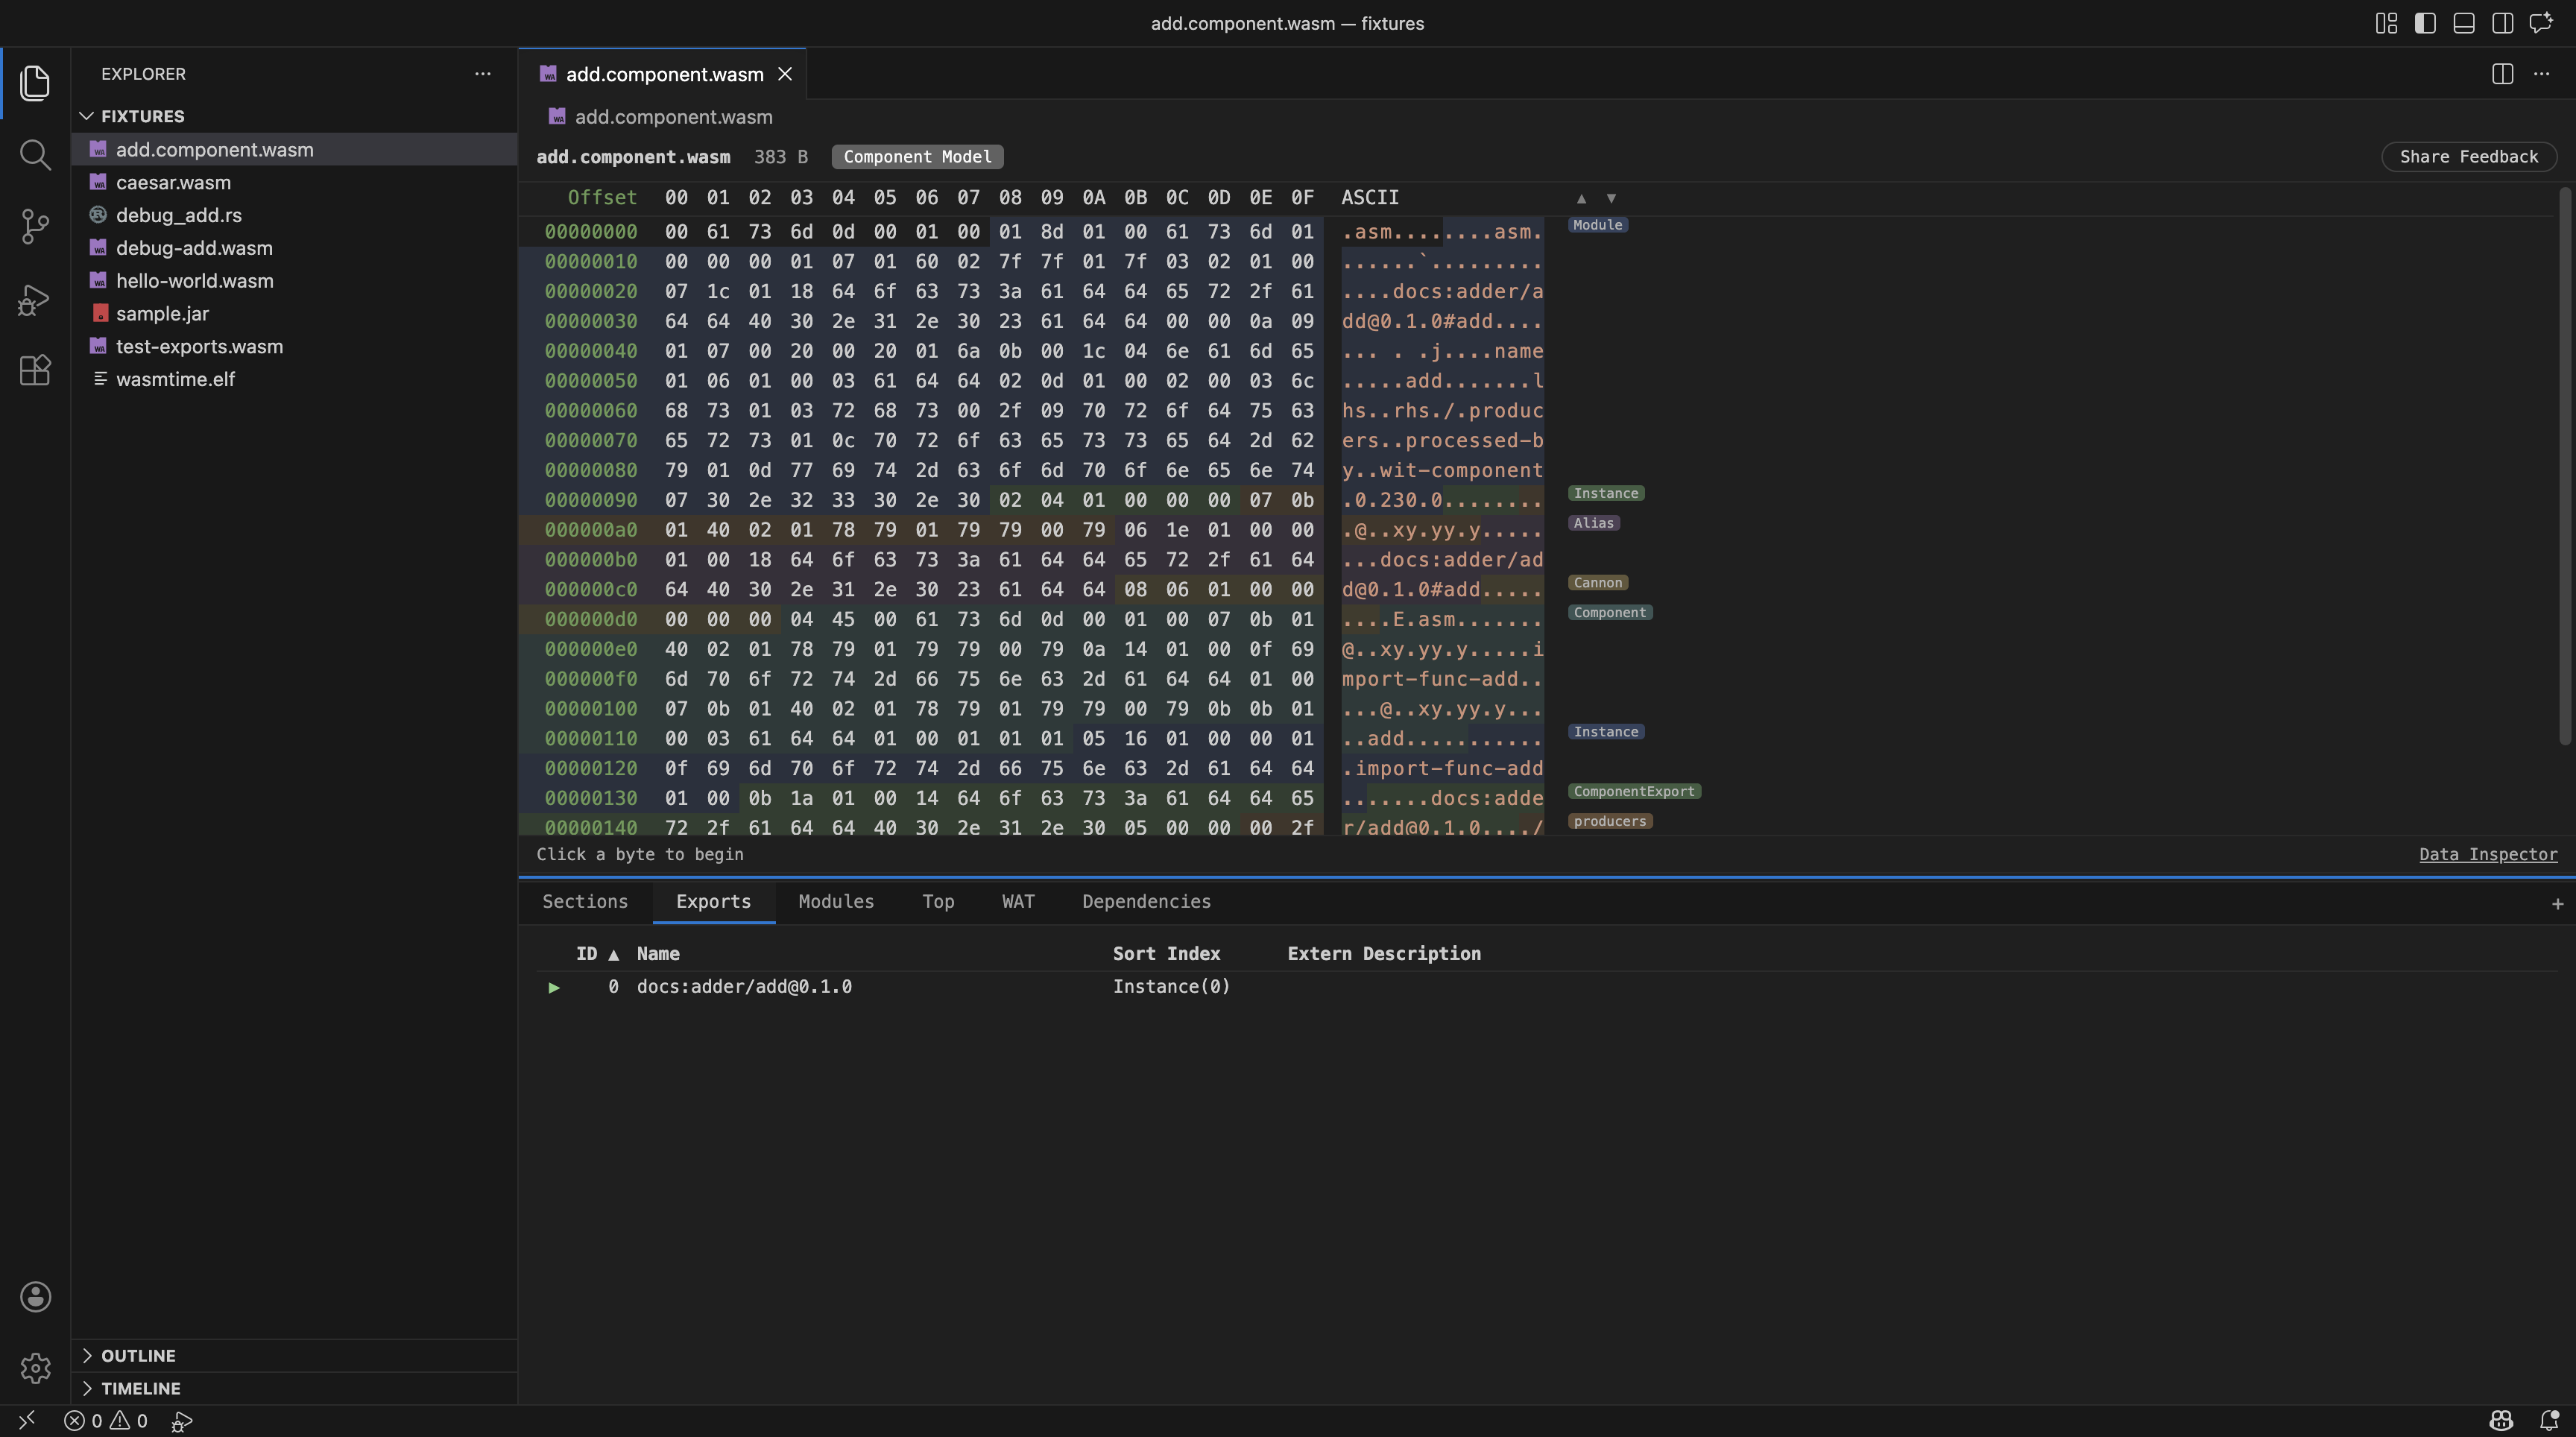
- Automatic dependency resolution — when a component imports interfaces from other components, Hexana searches the workspace for matching
.wasmfiles and resolves the dependency graph transitively. No manual wiring. - Nested-module navigation — components carry nested modules; Hexana exposes them through a virtual filesystem provider, so each nested module opens in its own editor tab via a deterministic URL.
- Submodule → parent backreference — when you open a nested module, the editor toolbar shows a link back to the containing component.
- Virtualized WAT for embedded modules (0.6.1) — the WAT panel on a component binary renders each embedded core module using virtual scrolling. A selector at the top lets you switch between modules when a component contains more than one.
- Dependencies diagram (0.8.0) — the Dependencies tab shows the internal dependency graph of the component — core modules, nested components, instances, and interface imports / exports — as a node diagram. See
component-model.mdandanalysis-tabs.md.
See component-model.md.
Settings
Three settings under Settings → Extensions → Hexana:
| Setting | Default | Effect |
|---|---|---|
hexana.enableStatistics |
true |
Toggle anonymous usage statistics collection. When false, no analytics events are sent regardless of the global VS Code telemetry setting. |
hexana.wasmtimePath |
"" |
Override the Wasmtime executable path. Empty = use whatever is on PATH. |
hexana.mcp.javaHome |
"" |
Override the JDK used to launch the on-demand MCP server. Empty = use JAVA_HOME / PATH. JDK 21+ required for MCP. |
See settings.md.
Telemetry
Hexana collects anonymous usage statistics through PostHog, gated by both:
- The global VS Code telemetry setting (
vscode.env.isTelemetryEnabled). - The Hexana-specific
hexana.enableStatisticssetting (defaulttrue).
Both must be on for any event to be sent. Toggling either at runtime takes effect immediately (no restart) — the analytics client flushes pending events and reinitialises.
A consent notice is shown on first activation. JetBrains' privacy notice applies: https://www.jetbrains.com/legal/docs/privacy/privacy/.
Resizable layout
Drag the divider between the hex viewer and the analysis panel to adjust the split. The layout persists across editor reopens.
Indices and parsing
- Hexana parses
.wasmbinaries in the webview using the sharedwasmParserandbinaryProviderKotlin Multiplatform modules. No external service or network request. - Parsing is streaming-friendly — large modules (multi-MB) render incrementally.
- The extension host (TypeScript) handles VS Code-specific I/O; all WASM logic lives in Kotlin/JS layers.
What this version does not do (yet)
Compared to the JetBrains IntelliJ plugin, the VS Code extension does not ship:
- WIT language support (parser, inspections, completion, navigation).
- Editable WAT view.
- Java-side completion / inspections for GraalWasm or Chicory.
- JS / TS-side type inference for
WebAssembly.instantiate. - GraalVM debug (GraalVM is run-only). Node.js and browser debug are available since 0.4.0 over CDP; Wasmtime debug uses the gdbstub path since 0.10.0 (wasmtime 44+) or
lldbon older wasmtime; WAMR useslldb. - Goto Symbol contribution scoped to
.witdeclarations and.wasmexports. - Decoded JVM artifact views (the three-tab
.classview and the.jitviewer) and the switchable AOT / Cranelift disassembler backend. (Archives.jar/.zip/.war/.apkopen with a hex + entry list since 0.3.0; nested.classentries open in the hex viewer, not the decoded class view.)
These are tracked for future versions; some are JetBrains-only by design (where they depend on IntelliJ Platform APIs without a VS Code equivalent).
See also
getting-started.md,analysis-tabs.md,run-support.md,component-model.md,settings.md,troubleshooting.md.- JetBrains plugin documentation for the IntelliJ-side capabilities.