Get started with Databao
Databao is a powerful data agent that helps you query, clean, and visualize your enterprise data securely within your environment.
In this tutorial, you’ll learn how to install the Databao Python SDK, configure sample data sources, and get reliable answers to your questions about a sample dataset. You’ll also explore how to work with agents and threads, retrieve results in different formats, and try some of advanced Databao’s features.
Prefer digging into code right away? Follow this tutorial in Colab
Before you begin
This tutorial has been tested in Google Colab. You can reproduce the steps in another Jupyter notebook or Python environment, but it may require adjusting some steps.
- If you use an environment other than Colab, make sure the Python version is 3.10, 3.11, 3.12, or 3.13.
- If you want to use a cloud OpenAI LLM instead of a local model running in Ollama, get an API key .
- If you follow this tutorial on your local machine and want to use a local Ollama model, install Ollama , and download a model. We recommend using Qwen3-8B.
Step 1. Install Databao and other packages
Open a new Colab notebook
If you don’t want to copy and paste code into a new notebook, you can follow this tutorial in Colab
Install Databao and other packages:
!pip install -q databao duckdb matplotlib pandas seabornImport the packages and download the sample dataset
# Import packages
import duckdb
import pandas as pd
import matplotlib.pyplot as plt
import seaborn as sns
from pathlib import Path

# Import Databao
import databao
from databao import LLMConfig
from databao.configs import LLMConfigDirectory

# Download the sample DuckDB database
!gdown https://drive.google.com/uc?id=16aN4_vFeIASKheAtlo8js3BS1NhrAdDU
!gdown https://drive.google.com/uc?id=1mUus17rWWYGK3ikbBFcx7PJBdliv9poE

# Connect to the local sample database
DB_PATH = "web_shop.duckdb"
conn = duckdb.connect(DB_PATH, read_only=False)
print(f"Connected to DuckDB database: {DB_PATH}")Downloading...
From: https://drive.google.com/uc?id=16aN4_vFeIASKheAtlo8js3BS1NhrAdDU
To: /content/web_shop.duckdb
100% 8.66M/8.66M [00:00<00:00, 291MB/s]
Downloading...
From: https://drive.google.com/uc?id=1mUus17rWWYGK3ikbBFcx7PJBdliv9poE
To: /content/duckdb_schema_overview.md
100% 3.84k/3.84k [00:00<00:00, 20.5MB/s]
Connected to DuckDB database: web_shop.duckdbStep 2. Configure an LLM
Databao is designed to work with both local and cloud LLMs. You can choose whether you want to use a local Ollama model or an OpenAI cloud model.
Local LLM (Ollama)
The local model runs isolated in the Colab compute. If you choose this option, downloading and setting up the model will take a few minutes.
The responses depend on the available compute resource and may be slower compared the cloud model.
-
To download and setup ollama with the Qwen3-8B model, add the following code cell:
Notebook cell!gdown https://drive.google.com/uc?id=1W_HuqVsj25lAI88zjE7jxWkj6A59-GFL !unzip models_qwen3_8b.zip -d ollama_models !curl https://ollama.ai/install.sh | sh import os import subprocess OLLAMA_HOST = "127.0.0.1:1234" os.environ["OLLAMA_HOST"] = OLLAMA_HOST os.environ["OLLAMA_CONTEXT_LENGTH"] = "8192" os.environ["OLLAMA_MODELS"] = "/content/ollama_models/models" subprocess.Popen(["ollama", "serve"]) -
Add the LLM config:
Notebook cellllm_config = LLMConfigDirectory.QWEN3_8B_OLLAMA
Step 3. Initialize an agent and add data sources
An agent in Databao acts as the main interface for database connections and context. It can handle multiple threads or conversations, each operating independently on the same data sources.
agent = databao.new_agent(llm_config=llm_config)

# Register a DuckDB data source and context about the source
agent.add_db(conn, context= Path('/content/duckdb_schema_overview.md'))

# Register an example dataframe
cal = pd.DataFrame({
    "month": pd.date_range("2017-01-01", periods=6, freq="MS").strftime("%Y-%m"),
    "is_qtr_end": [False, False, True, False, False, True]
})

agent.add_df(cal, name="calendar_helper", context="Small helper calendar with monthly rows and a qtr-end flag.")

# Add project-wide context
agent.add_context(
    """
    Project‑wide notes:
    - Monetary values are in EUR unless stated otherwise.
    - Orders with status 'canceled' should be excluded from KPIs unless explicitly requested.
    """
)

print("Registered DBs:", list(agent.dbs.keys()))
print("Registered DFs:", list(agent.dfs.keys()))Registered DBs: ['db1']
Registered DFs: ['calendar_helper']Step 4. Start a thread
Threads act as individual conversations within an agent. While multiple threads share the data sources and context managed by an agent, each thread has its own message history allowing you to ask follow-up questions and build on previous answers within that thread.
By default, threads execute immediately (eager mode) and materialize the result. You will learn how to turn it off and use lazy mode in later steps.
Create a thread a make a request
To create a new thread and ask a question that will execute immediately, use the following code:
thread = agent.thread()

thread.ask(
    """
    Return a compact KPI table with:
    - orders_count
    - total_revenue
    - average_order_value
    """
)======== <THINKING> ========
To answer your request, I will:
1. Calculate the total number of orders (orders_count), excluding orders with status 'canceled'.
...
[tool_call_output: 'submit_query_id']
'''
Query 6-0 submitted successfully. Your response is now visible to the user.
'''
======== </THINKING> ========
orders_count total_revenue average_order_value
0 542 664673.8 1226.335424
Output the result as a dataframe
You can access the result as a dataframe. Because this request has already been executed, the results are cached in the thread.
df_kpis = thread.df()
df_kpis orders_count total_revenue average_order_value
0 542 664673.8 1226.335424Check out the SQL query or code
To review the code Databao generated to produce results, use the .code() method:
print(thread.code())SELECT
COUNT(DISTINCT o.order_id) AS orders_count,
SUM(p.payment_value) AS total_revenue,
SUM(p.payment_value) / COUNT(DISTINCT o.order_id) AS average_order_value
FROM db1.main.dim_orders o
JOIN db1.main.fct_order_payments p ON o.order_id = p.order_id
WHERE o.order_status != 'canceled'Step 5. Ask follow-up questions
Threads have memory, so new requests can reference previous answers in the same thread.
Ask a question about previous results
In the same thread, ask a new question about the results calculated previously:
thread.ask("Add average delivery days and average review score to the KPI table. Keep it tidy.")======== <THINKING> ========
To add the requested KPIs, I will:
...
[tool_call_output: 'submit_query_id']
'''
Query 15-0 submitted successfully. Your response is now visible to the user.
'''
======== </THINKING> ========
orders_count total_revenue average_order_value average_delivery_days average_review_score
0 542 2535254.74 4677.591771 9.983549 3.382784
Display results in a dataframe
You can access the results in a dataframe:
df_kpis_extended = thread.df()
df_kpis_extended orders_count total_revenue average_order_value average_delivery_days average_review_score
0 542 2535254.74 4677.591771 9.983549 3.382784Step 6. Try chaining requests in lazy mode
If you know that your flow requires several steps,
you can chain several .ask() calls in lazy mode
and then materialize the final result using .df(), .plot(), .text(), or .code().
Start a lazy thread
Initialize a new thread and ask several chained question. Because the thread is created in lazy mode, Databao won’t compute it yet.
lazy_thread = agent.thread(lazy=True)
(
    lazy_thread
        .ask("Compute monthly revenue from june till september of 2025.")
        .ask("Include a 2-month moving average.")
        .ask("Name the columns month, revenue, revenue_ma2.")
)Unmaterialized Pipe.Calculate the response
df_trend = lazy_thread.df()======== <THINKING> ========
To answer this, I will:
1. Define "revenue" as the sum of item_price from sales, excluding orders with status 'canceled'.
...
[df: name=df, showing 4 / 4 rows]
| month | revenue | revenue_ma2 |
|:--------|----------:|--------------:|
| 2025-06 | 166537 | 166537 |
| 2025-07 | 179467 | 173002 |
| 2025-08 | 164677 | 172072 |
| 2025-09 | 162770 | 163723 |
[tool_call: 'submit_query_id']
'''
{"query_id":"20-0","result_description":"Columns are named as requested: 'month' (YYYY-MM), 'revenue' (monthly revenue in EUR), and 'revenue_ma2' (2-month moving average of revenue). The moving average is the average of the current and previous month's revenue. For June, it is just June's revenue, as there is no previous month in the selected range.","visualization_prompt":"Line chart: x-axis month, y-axis revenue and revenue_ma2, two lines, title 'Monthly Revenue and 2-Month Moving Average (June-Sep 2025)'."}
'''
[tool_call_output: 'submit_query_id']
'''
Query 20-0 submitted successfully. Your response is now visible to the user.
'''
======== </THINKING> ========Visualize the result
To visualize calculation results, use the .plot() method.
Databao uses Vega-Lite for charts, and you can specify any supported chart type in your prompt
lazy_thread.plot("Line chart of revenue and revenue_ma2 by month")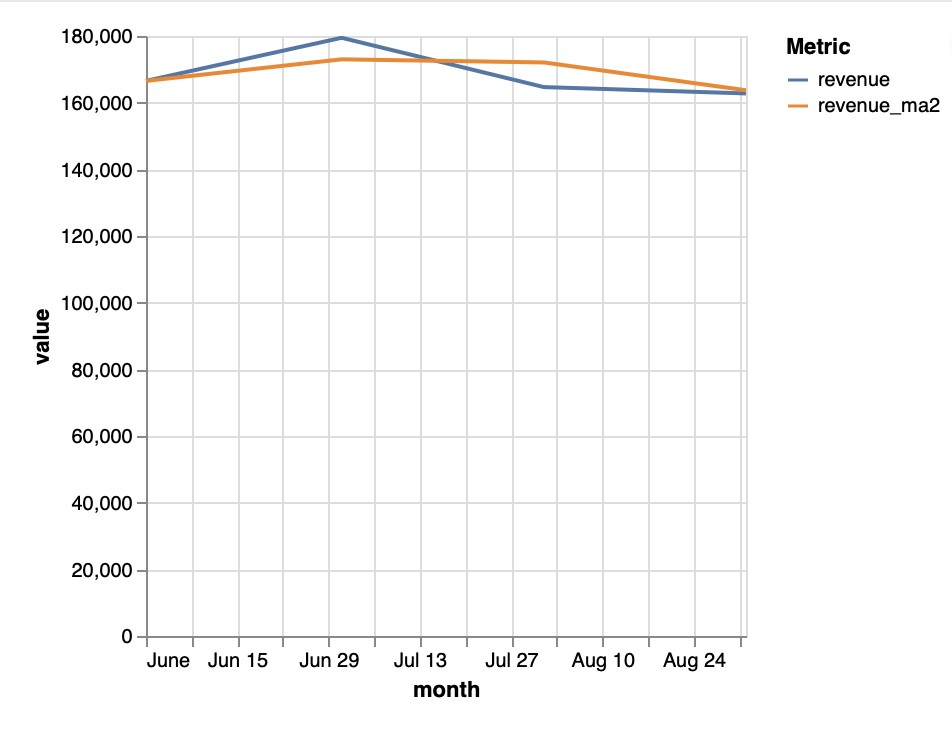
Step 7. Ask for explanations
In addition to dataframes and visualizations, Databao can provide text answers about your data which is convenient for summaries.
lazy_thread.ask("Write 3 bullet insights about the revenue trend you just computed. Keep it concise.", stream=False)
print(lazy_thread.text())- Revenue peaked in July 2025 at €179,467, showing a strong mid-summer sales boost.
- After July, revenue declined steadily through August and September, dropping to €162,770 by September.
- The 2-month moving average smooths out fluctuations, highlighting a gradual downward trend after the July peak.Step 8. Visualize dataframes manually
The dataframes returned by .df() are standard pandas dataframes,
so you can use them wherever you see fit.
For example, you can visualize the result dataframe using seaborn .
if {"month", "revenue"}.issubset(df_trend.columns):
    plt.figure(figsize=(7, 3.5))
    sns.lineplot(data=df_trend, x="month", y="revenue", marker="o")
    plt.xticks(rotation=45, ha="right")
    plt.title("Monthly revenue (from Databao df)")
    plt.tight_layout()
    plt.show()
else:
    print("df_trend columns:", df_trend.columns.tolist(), "— adjust the plotting code to your column names.")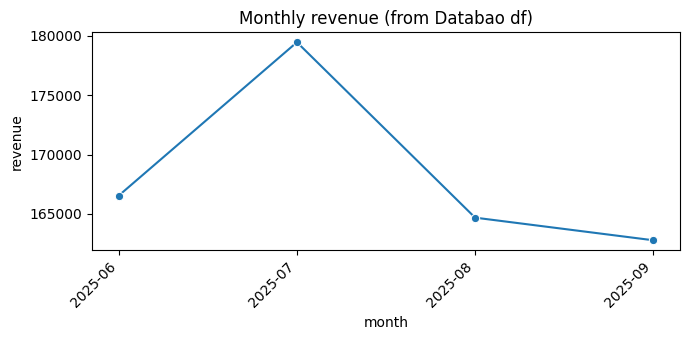
Step 9 (Optional). Try advanced features
Disable streaming of the model’s thinking process
If you prefer to get shorter responses from Databao, you can turn off the streaming of the LLM’s thinking process. This will make the output cleaner and more readable, but it may sometimes seem like the model is taking longer to respond.
There are three ways to disable streaming:
-
To disable streaming for a new thread, specify
stream_ask=Falsewhen creating one:Notebook cellno_stream = agent.thread(stream_ask=False) no_stream.ask("Compute the top 5 products by revenue in june 2025.") df_top5 = no_stream.df() df_top5Outputproduct_id product_category_name_english total_revenue 0 437e682e8b761b3191da4fca20307e94 Furniture & Decor 8278.09 1 60690a285907cb1676b2f5f5e544d5af Musical Instruments 7418.62 2 6fee3c3366b596ecfae722087b1a58c7 Computers 5567.23 3 c658bc04de920254d81ccd80b33078f4 Computers 5081.73 4 8efe1caed4e9e8bf475630c46b8108d2 Furniture & Decor 5060.11 -
To disable streaming for an
.ask()call in an existing thread, addstream=Falsein the call:Notebook cellthread.ask("Now compute total orders by category.", stream=False) orders_by_country = thread.df() orders_by_country.head()Outputcategory total_orders 0 Cool Stuff 103 1 Toys 95 2 Pets 86 3 Office Supplies 85 4 Fashion & Shoes 84 -
To make threads lazy by default in a new agent, create the agent as follows:
Notebook celllazy_agent = databao.new_agent( llm_config=llm_config, default_lazy_threads=True, ) lazy_agent.thread().ask("This won’t run until you call .df() because lazy is now the default.")
Enable interactive charts
To make charts interactive, add .interactive() when calling .plot().
This is an experimental feature in Databao, so things might not work perfectly yet.
thread = agent.thread(stream_ask=False)
thread.ask(
    """
    Return a KPI table with:
    - orders_count
    - total_revenue
    - average_order_value
    per category for july 2025
    """
)
thread.plot().interactive()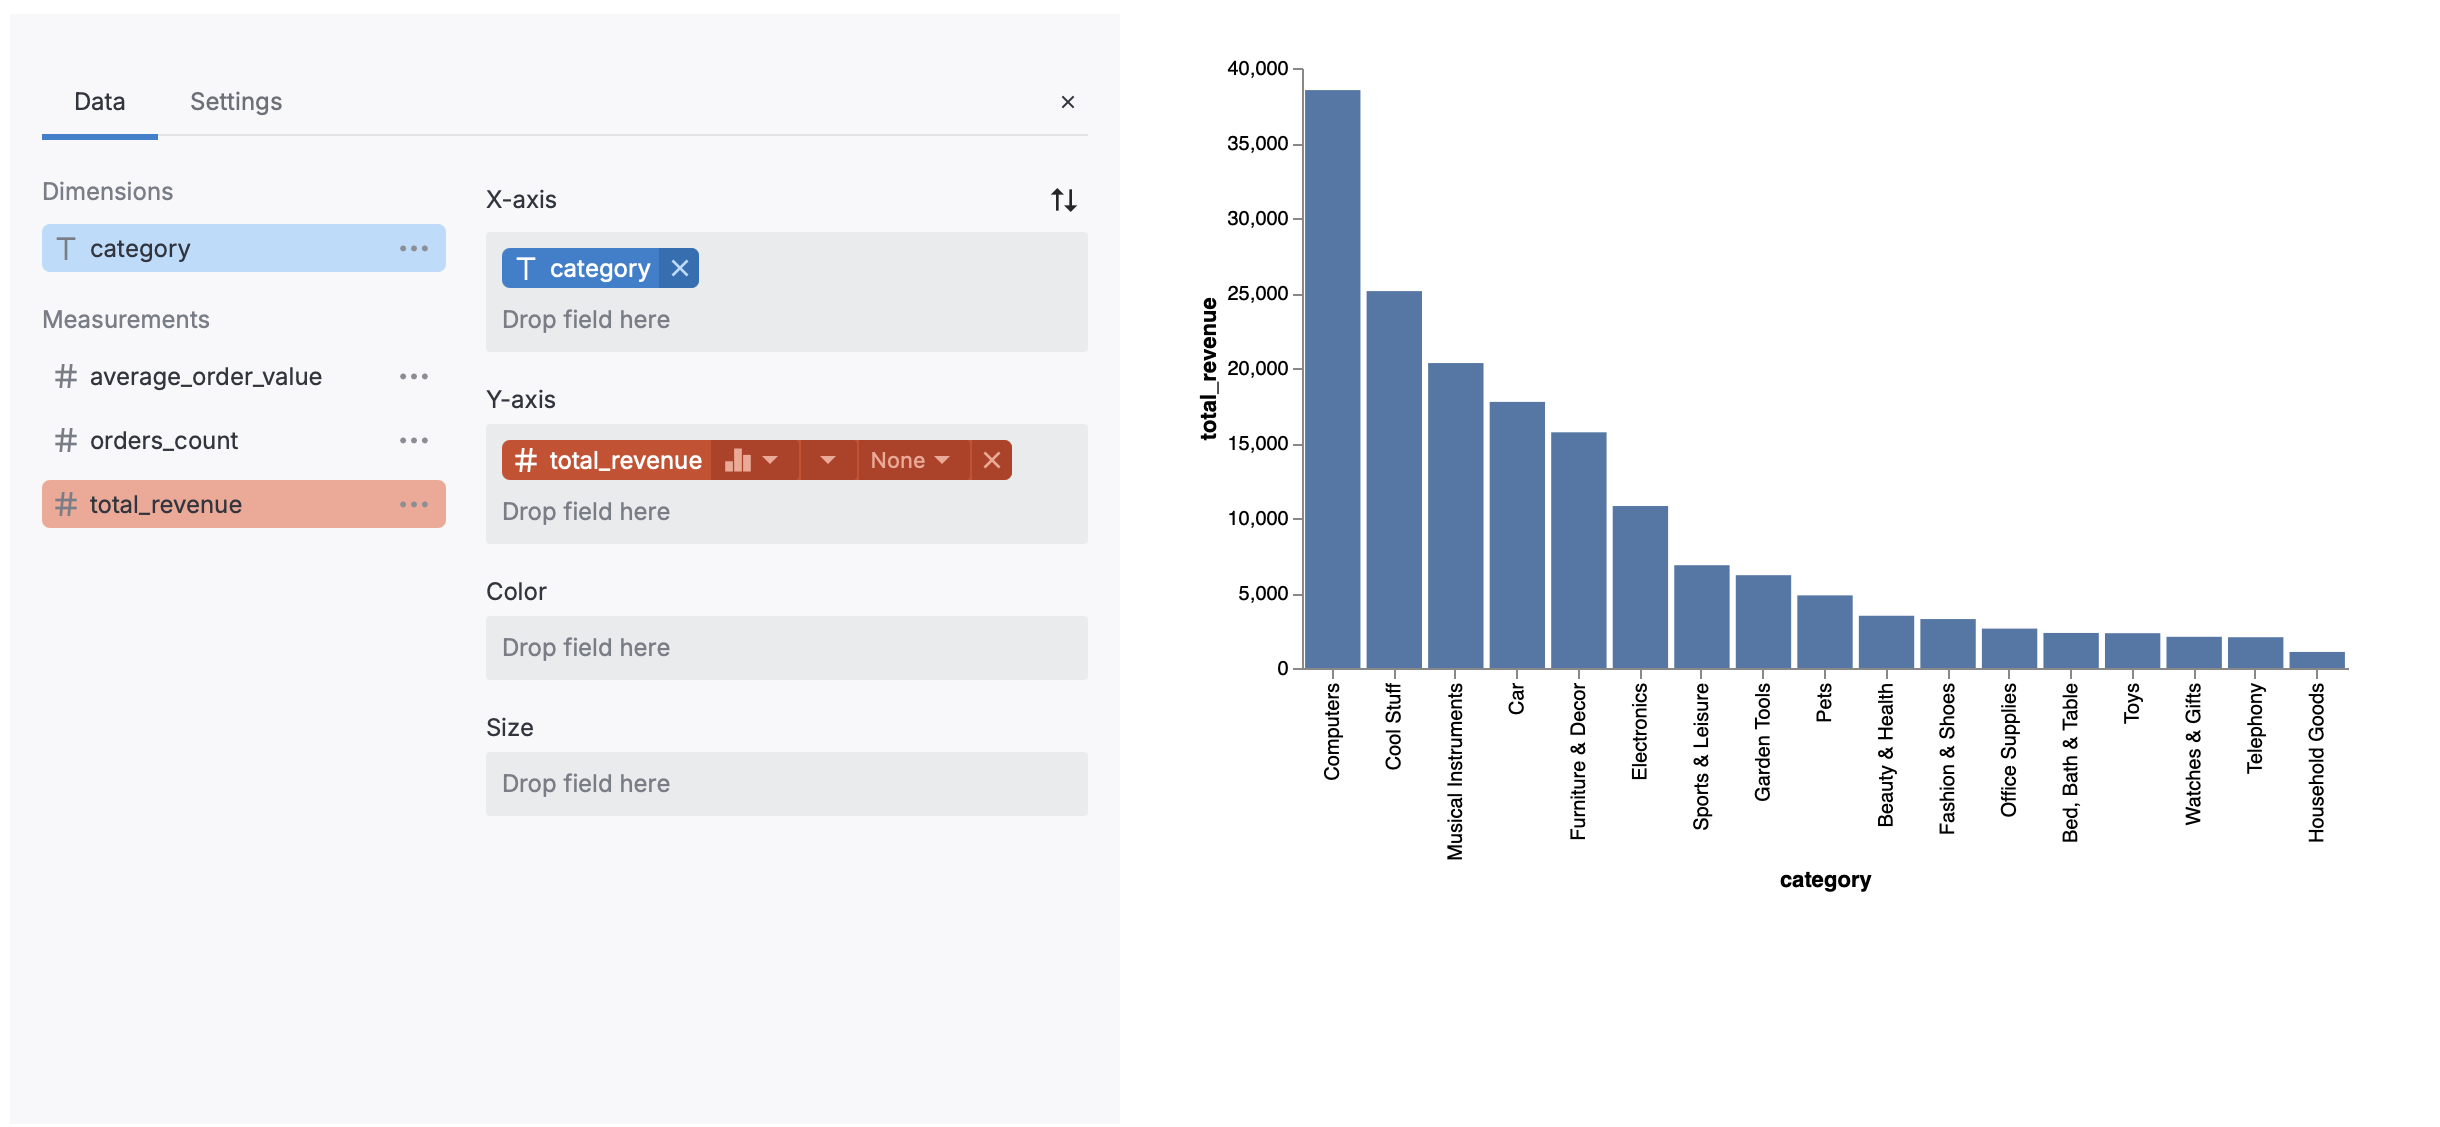
Adjust row limits
To limit the number of rows in the dataframe output, use row_limit when calling .ask():
small_sample = agent.thread(lazy=False)
small_sample.ask("Return all raw orders rows", rows_limit=3).df() order_id customer_id order_status order_purchase_timestamp order_approved_at order_delivered_carrier_date order_delivered_customer_date order_estimated_delivery_date
0 ord_0001 cust_0001 shipped 2025-08-31 11:26:00 2025-08-31 12:47:00 2025-09-04 02:26:00 NaT 2025-09-12 11:26:00
1 ord_0002 cust_0002 invoiced 2025-09-08 19:19:00 2025-09-08 21:54:00 NaT NaT 2025-09-14 19:19:00
2 ord_0003 cust_0003 invoiced 2025-06-10 04:42:00 2025-06-10 05:59:00 NaT NaT 2025-06-29 04:42:00What’s next
Now that you’ve tried Databao using a sample project, connect it to your data and see how it can help you with your daily tasks.
Join the Databao Discord server!
Stuck or have questions about Databao? Join our Discord to get help, connect with developers, and request features.
Join Discord